Aerobic Decoupling In Real Time

As per the Polarized thread I am developing a Garmin IQ data field that will show aerobic decoupling in real time on a supported Garmin unit.

Here is how it will work

There will be two settings you can change

  1. Warmup duration
  2. Baseline duration

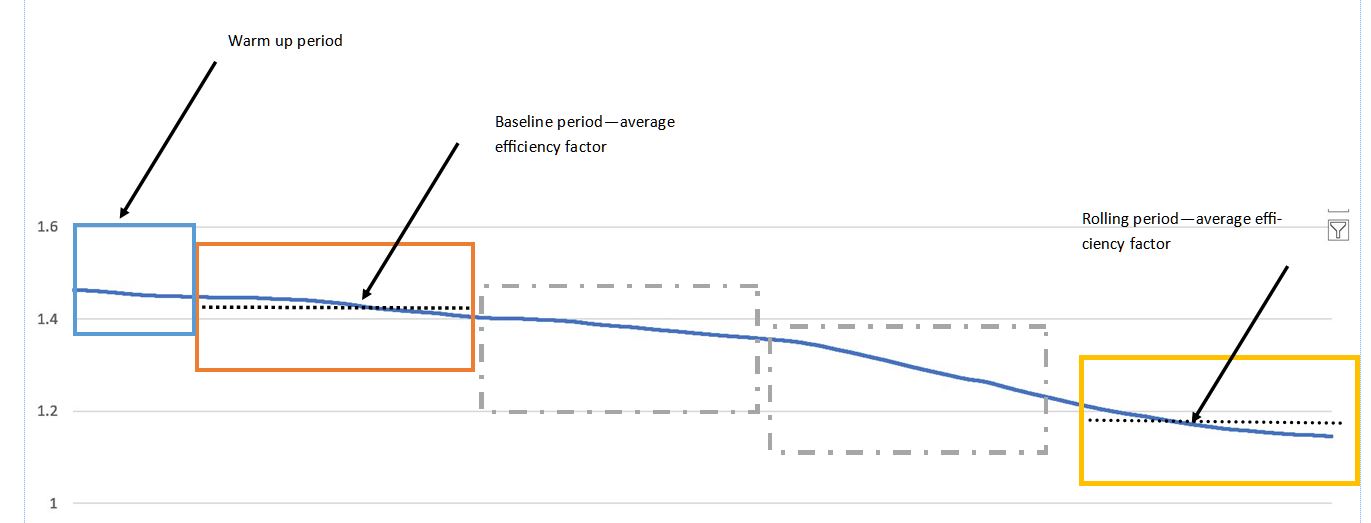
The defaults at the moment are 20 mins for warm up, and then the next 30 mins for the baseline.

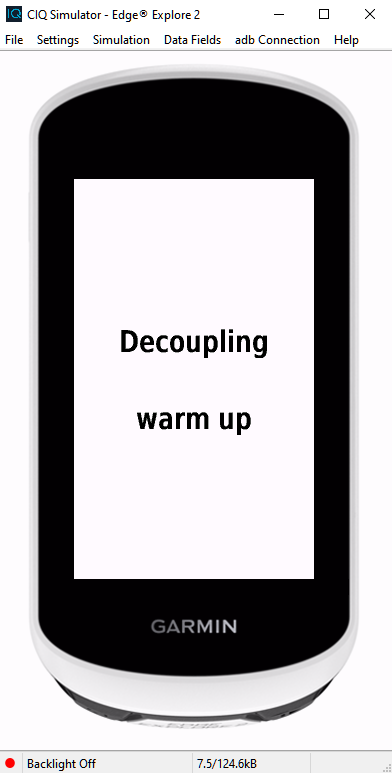
During the warm up period the data field doesn’t do anything. After the warm up period the data field collects power and heart rate data over the baseline duration. At the end of the baseline duration it calculates normalised power and average heart rate and derives an efficiency factor. This is marked as the baseline efficiency factor, which for current defaults will be calculated from 30 minutes of power and heart rate data.

Every second after the baseline, it updates the normalised power and average heart based on a rolling duration equal to the baseline duration. For instance, if you sett he baseline duration to 60 minutes than the normalised power is that calculated from the last 60 minutes of power data, same for average heart rate. With the new normalised power and average heart rate it calculates the latest efficiency factor and compares this to the baseline efficiency factor, calculating a percentage difference. This percentage difference is shown as decoupling and is shown as a percentage to 1 decimal place. decoupling may be positive or negative.

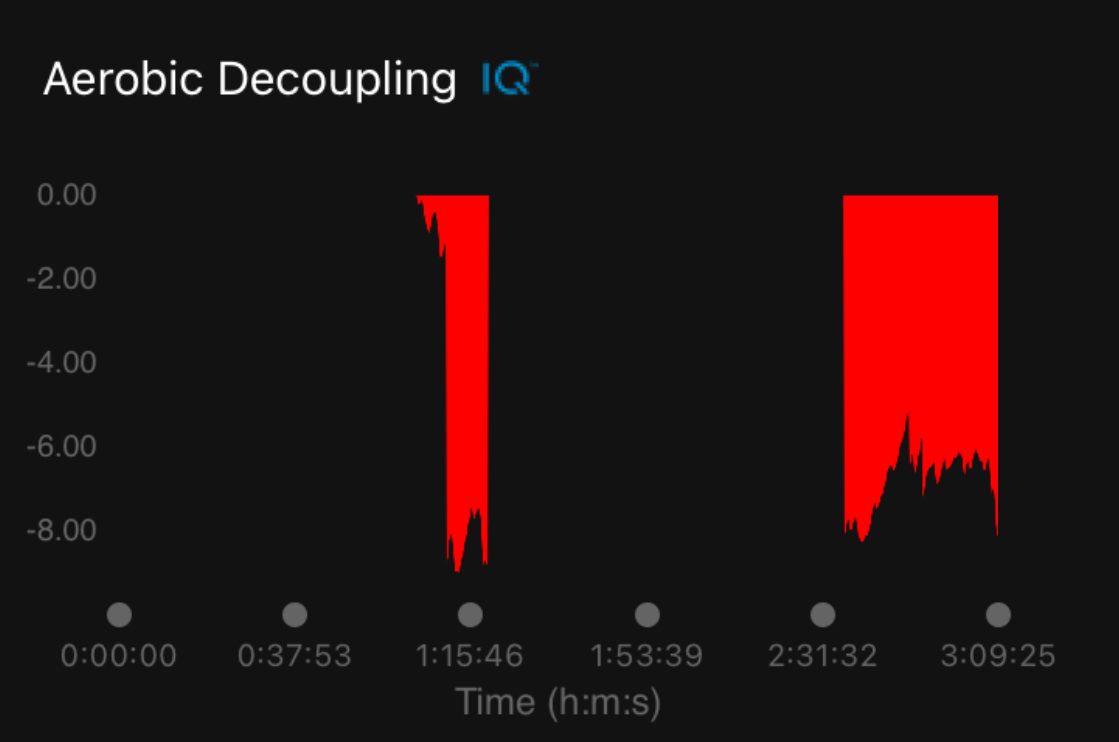
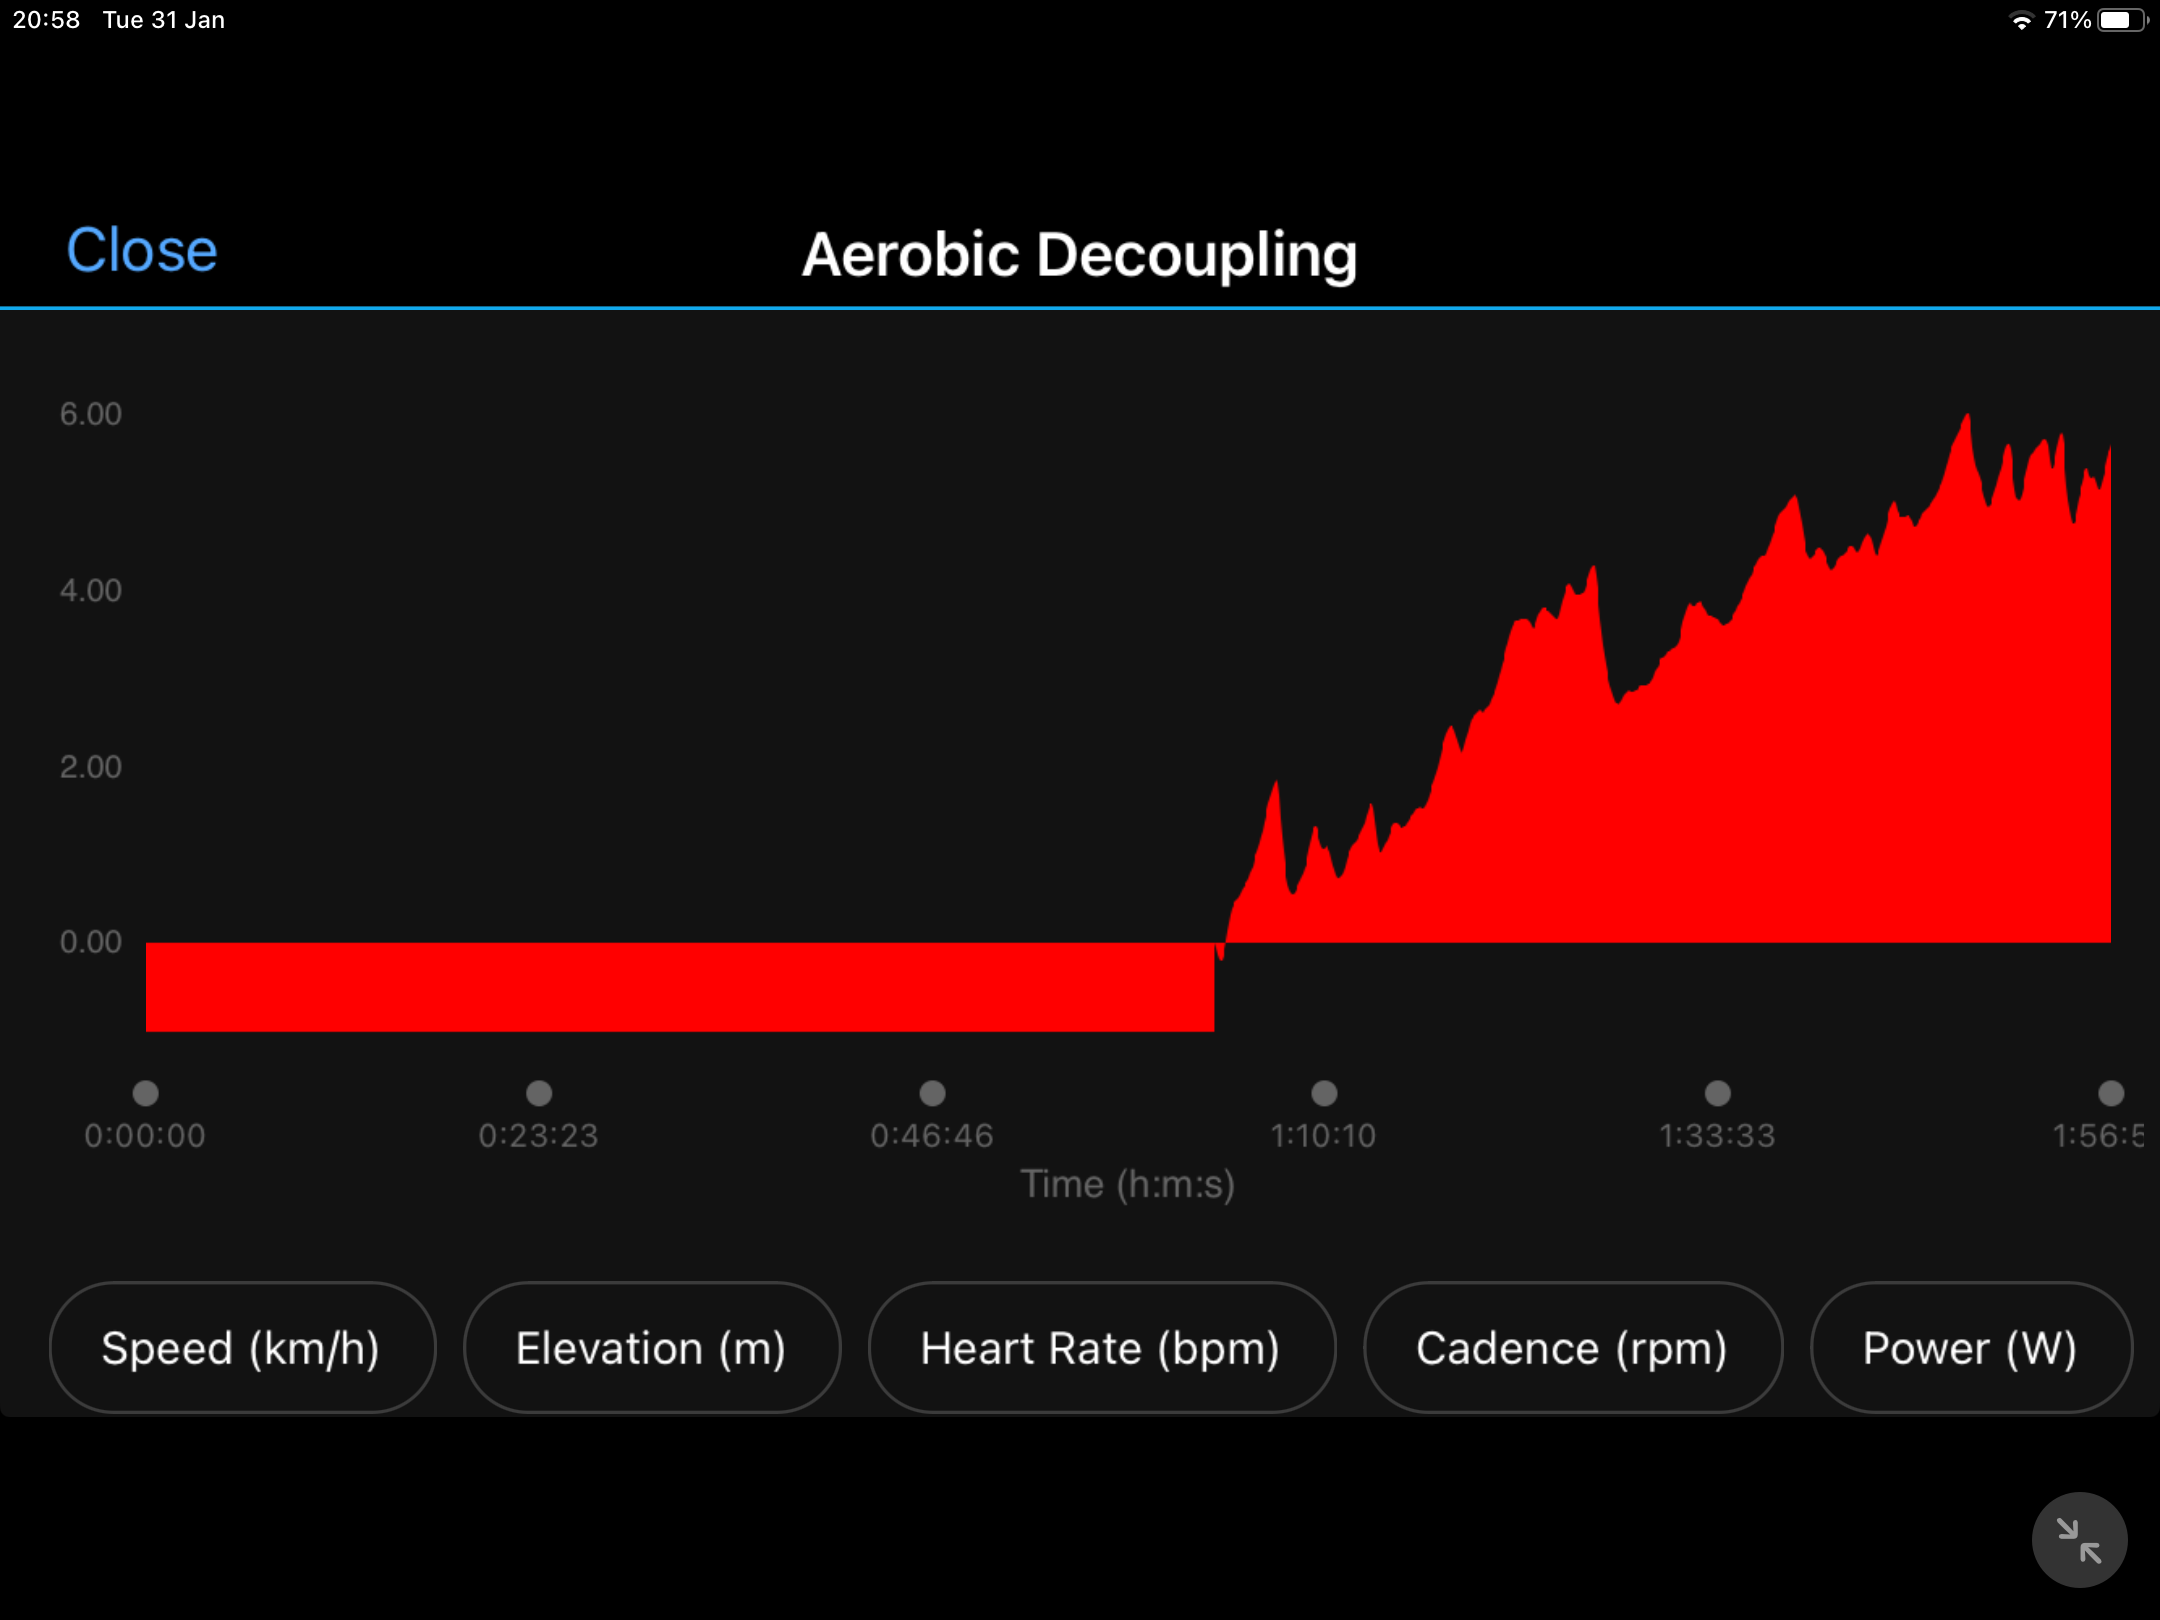
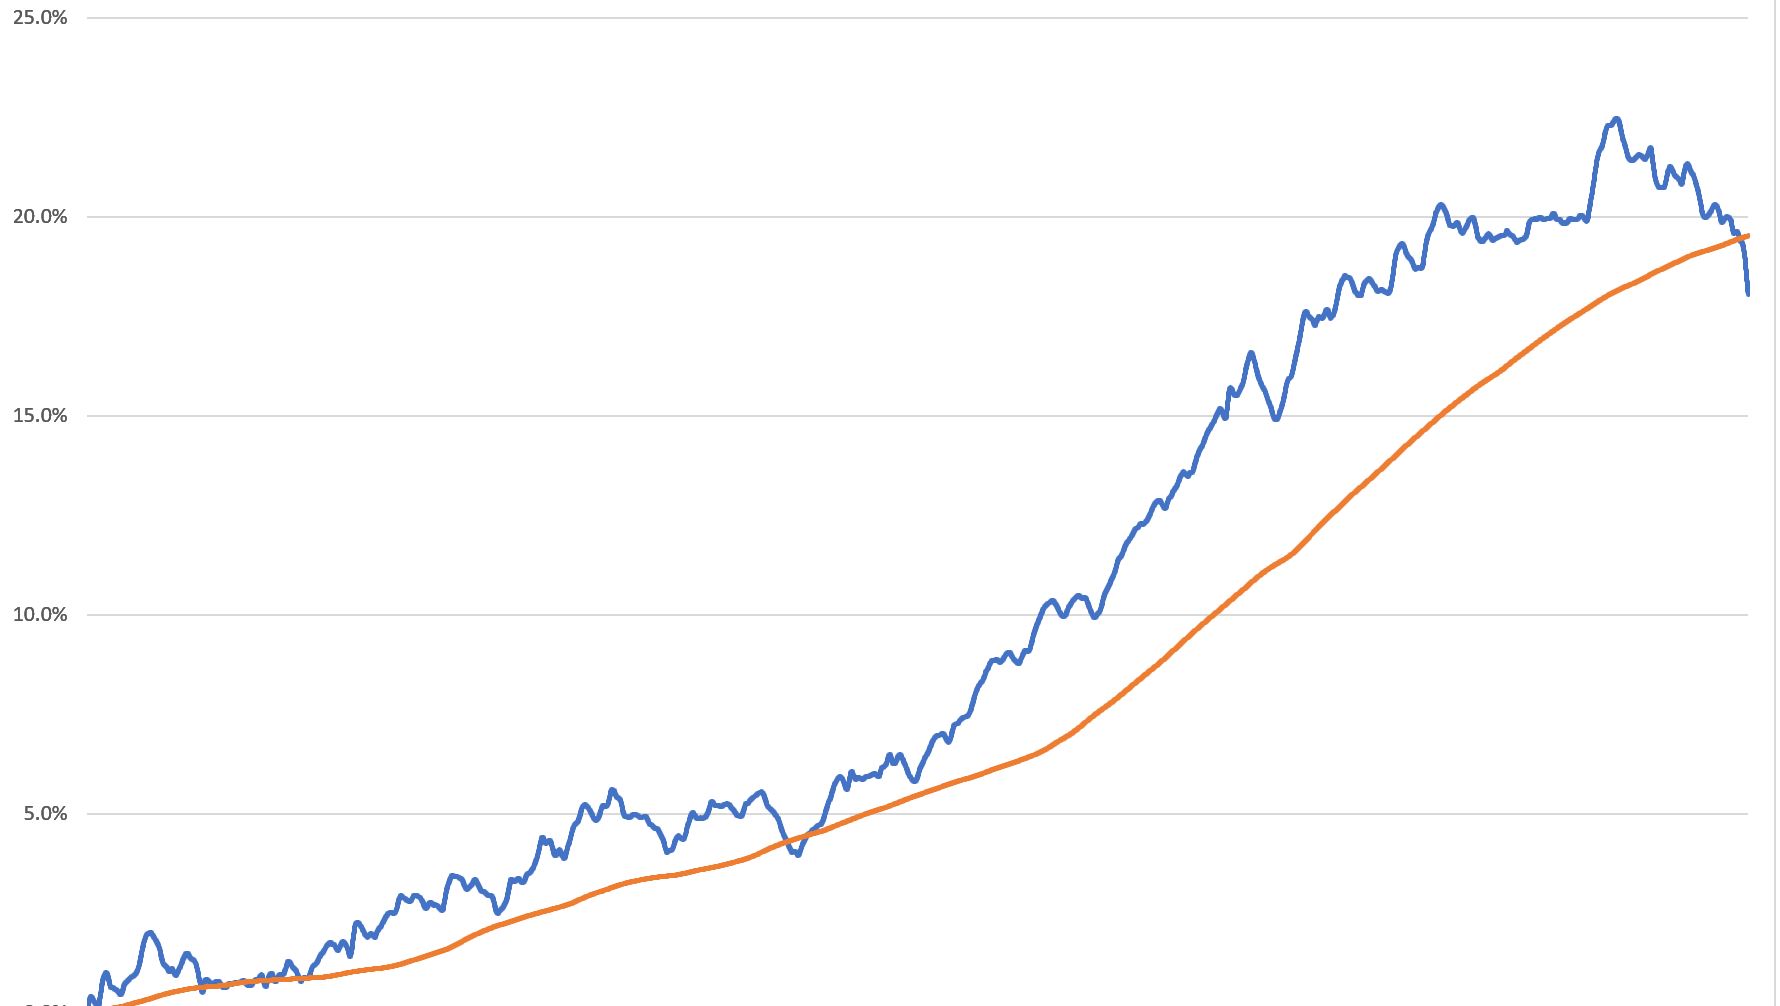
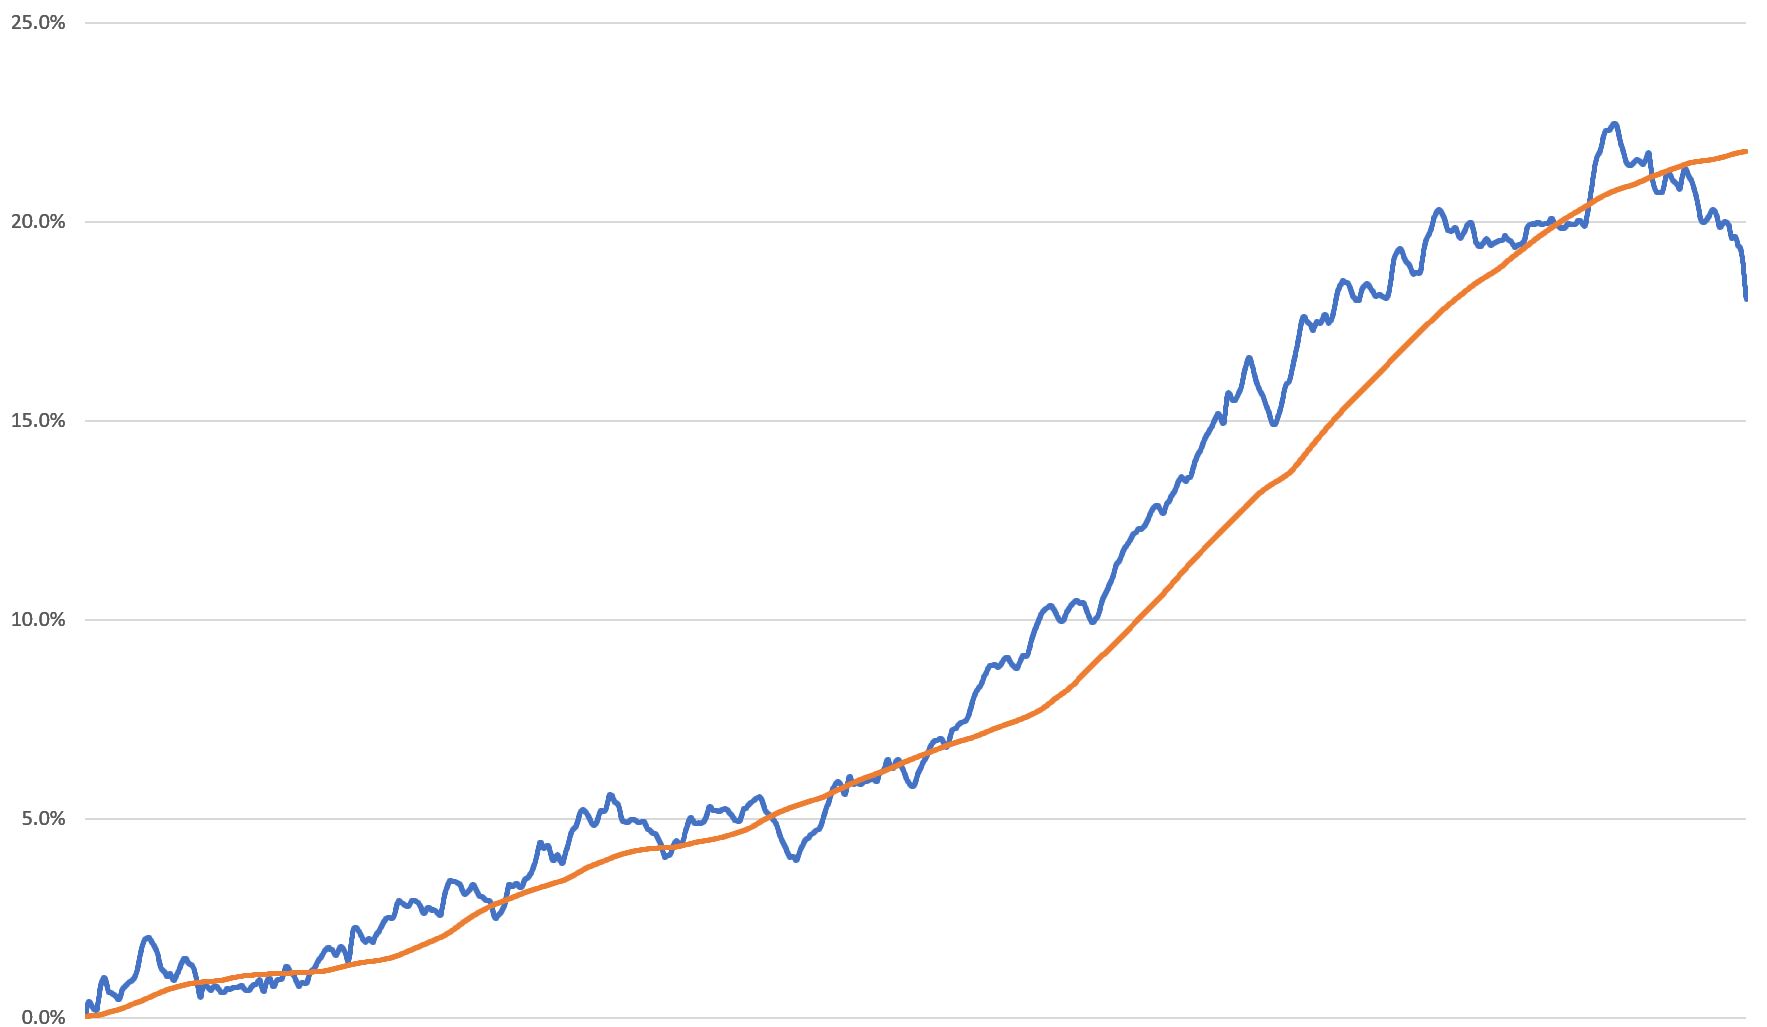
Below is a screen clip of the field, when running in the Garmin IQ simulator against my real data from a Z1/Z2 (with 5 seconds of zone 3!) ride on Saturday 7th January 2023. As the field calculates decoupling over a rolling period I can’t fast forward through the simulator to see the figure at the end. I know from software analysis of this ride of 2 hours 43 mins that the aerobic decoupling of full ride was calculated at -1.27%. I’m waiting for the simulator to tick along to the end of my activity to see if it generates the same number, a sign I’ve got the calculations and rolling windows for normalised power and average heart rate working correctly.

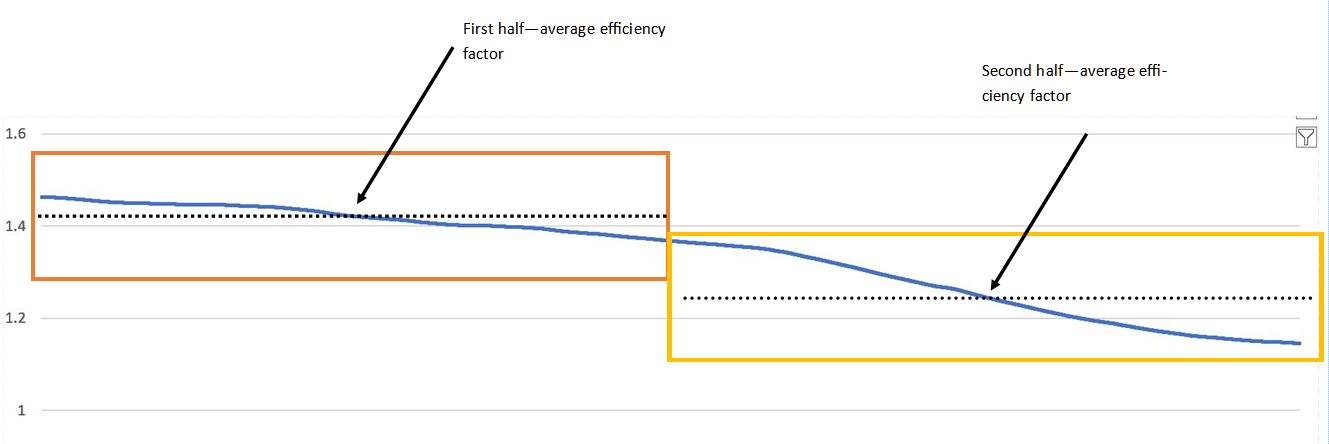
Previously, it’s only been possible to see this figure during post ride analysis in software which usually compares the efficiency factor for the second half of a ride, against the efficiency factor for the first half.

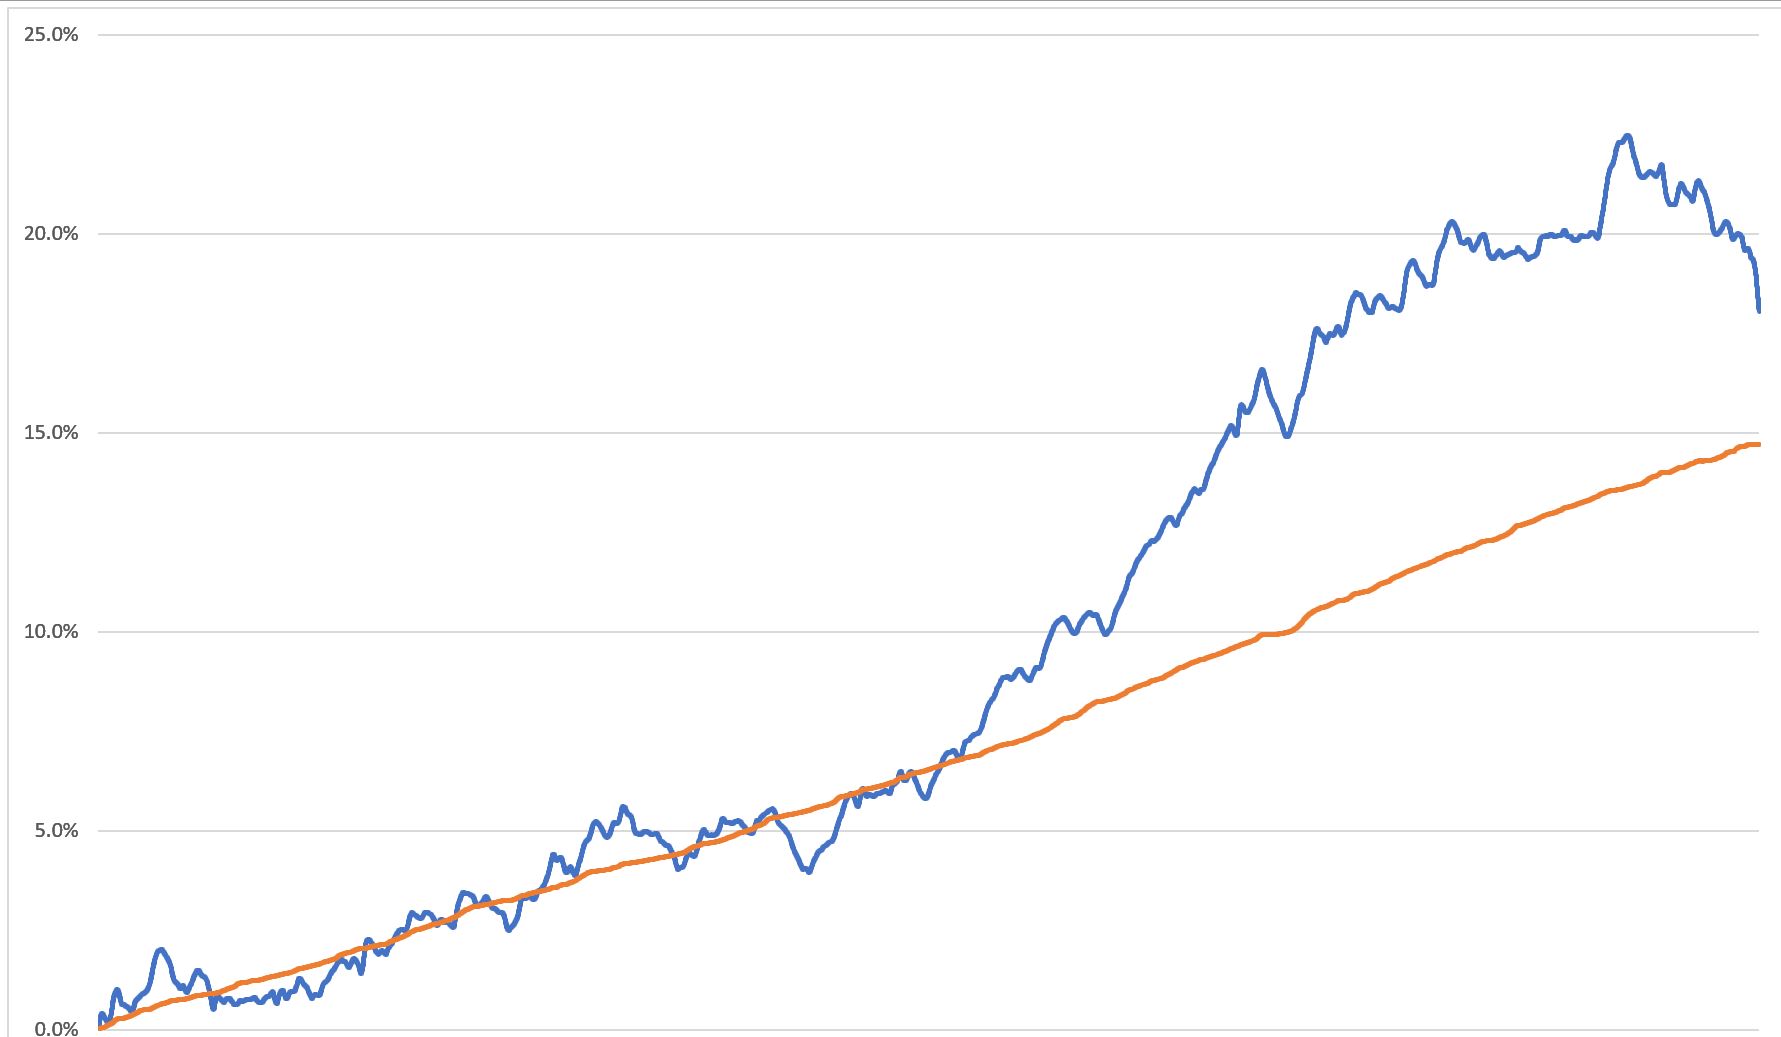
The question thus becomes how to make best use of this field during a steady endurance ride. Joe Friel talked about getting decoupling below 5% for the duration you aiming at before moving onto the next stage of your training. But what might we be able to do when we can see the number in real time during a ride?

I’ve had some thoughts below

  1. If you are sure you’ve fuelled and hydrated enough and are not unduly affected by heat, but you are seeing your aerobic decoupling rising past 5% after a period of well disciplined riding in Z1 / Z2 (of 5 zone model) heart rate.

Is it time to bring the ride to a close and head back to base, to ensure you don’t induce an excessive amount of fatigue. You’ve reached the duration limit of your current aerobic endurance this time?

  1. If you start to see your decoupling exceed 5% and the duration is way shorter than your typical endurance ride. You are sure you’ve fuelled and hydrated enough but feel affected by the heat.

It’s likely you are in the early stages of heat stress and need to take a break in the shade, take on more water and salts, and cool down? Then when you restart be sure to eat and drink plenty and stop in shade where necessary. If your decoupling continues to rise, it is a sign to bring your ride to a close and head for home, to prevent progressing into heat exhaustion and undue fatigue.

  1. If you start to see your decoupling exceed 5% and the duration is way shorter than your typical endurance ride. You’ve been pretty lax about fuelling / hydration, but are not unduly affected by heat.

It’s a sign that you need to take on some fuel and up your drinking rate to see if you can bring your decoupling under control. If you can’t and decoupling continues to rise, it’s time to bring your ride to a close and head for base.

  1. The decoupling is negative

What does this mean?

I’m not a coach or physiology expert, what do others think?

2 Likes

I’m curious as to what the coaches say about negative decoupling. I seem to never get positive decoupling, but always get negative.

I did at 2-hour trainer ride this morning (the atmospheric rivers situation in Northern Cal is pretty bad, so inside for a while).

At around very steady pedaling at 62% of HR max. In the last 3O minutes I had a negative decoupling of around -4%, which surprised me. Temperature went up a bit in the 2 hours, did not eat. It’s happened in low endurance efforts from time to time on the trainer.

I heard someone say that Friel said not to pay too much attention to negative decoupling on endurance rides until 2 hours plus.

Ultra endurance riders see this happen. There are times that 8 to 12 hours into an event the HR is lower for the usual power output. Let’s see what the experts say about this.
I

I’ve had situations where roughly an hour into a ride, I’d see negative decoupling for awhile. I attributed it at the time to a history of taking a long time to warm up, whether for workouts or races. These days, not so sure what it may have been, as there are so many confounding factors.

Have the calculation of percentage wrong way round and it comes up with negative decoupling when it should be positive. Seems to tie in with what the post ride software comes up with. But since it doesn’t save the calculation result into the fit file I’m relying on memory. Tested on a 5.5 hour Z2 ride yesterday with stonking headwind. I’ve got a 2 hour Z2 ride today and will make sure to look at the data screen at end of ride and compare with post ride software analysis.

It hasn’t crashed (yet) which is always a good sign.

1 Like

Famous last words about crashing.

I stopped at a cafe today and stopped and turned off the Edge whilst stopped. Then restarted after the break. Seems the power meter didn’t wake up again till I noticed about 15 mins later. Thus had power data for first half, then didn’t on restarting.

I thought I’d trapped when power data not available but if it was available then isn’t like above seems to have crashed it.

I’ll take a look later when reversing decoupling to be positive when it should. The field can then say no power if power meter not connected.

Phil, I spoke to a Garmin rep who is an avid cyclist. I mentioned that it was strange that out of all the metrics Garmin had none where for decoupling.

He mentioned that in the Garmin Connect app store, apps.garmin.com, there was a private decoupling app, titled Aerobic decoupling, and suggested I try that. I have been using it for the past two weeks. It’s based on an approach Sieler uses with %HRR/6 minunte max average power.

1 Like

I was aware of that one. It uses a fixed rolling 10 min window and it is version 0.0.5 thus very much beta. Doesn’t allow for warm up. I’ve tried rolling 10 minute windows and don’t believe that’s a big enough window based on what I’ve seen from my own rides.

Been away visiting I’ll be doing more testing of my data field next week after I’ve made some updates based on what testing has highlighted so far.

Now moved the checks for heart rate and power. If either is not available then you will see, and want to check your sensors are talking to your watch / edge.

I’m also working on writing this data field into the fit file now, so that it will be graphed in Garmin Connect

1 Like

Latest code update now on my Edge. The simulator showed it was writing the data into the fit file I saved. Now to see how it looks on my next endurance Z2 ride which is 2 hours tomorrow.

@steveneal

Just added these variants to the build list

fenix5plus
fenix5splus
fenix5xplus
fenix6
fenix6pro
fenix6s
fenix6spro
fenix6xpro

1 Like

I have had to change the way the rolling normalised power and average heart rate are calculated. This was due to out of memory issues on my Edge. Field now maxes at 9.3 Kb. It’s like being back in the 80s when I remember our compiled programs had to fit in 32 kilobytes memory on the mini computers. My Edge has 124 kilobytes available to the data field for reference.

Unfortunately on today’s outing the power meter didn’t reconnect with my Edge, after a cafe stop. As I wasn’t on the data screen showing aerobic decoupling it took a while to notice. Will have to see if I can get it to alert.

Today’s data isn’t valid and I think I messed up the rolling average heart rate calculation, when I changed it to optimise memory usage.

The good news, with my latest updates, is that the aerobic decoupling is getting written to the fit file and I can now see it at the bottom of the Garmin Connect graphs tab.

I’ll have time to review the rolling average calcs and get them corrected on Monday and tested next week on my next endurance outing.

Good news is it caught the power meter data not being available and the data field didn’t crash.

Had to switch simple moving averages to exponential moving averages so memory limits (of devices) not exceeded for data field. The exponential weightings are calculated such that the result is equivalent to a simple moving average over the baseline duration.

Think I’m reasonably happy with calculation and what’s written to the fit file. Stable since my last updates with no crashes. Need to see if I can improve the Garmin Connect graph period for warm up and baseline where not writing a value to the fit file. Maybe writing zero during those periods will do it? Getting closer to public beta.

Here’s a session where I’m working above and below VT1. It’s interesting how you can recover the decoupling a little if you dial it down for a bit.

cool thing, I train with a Fenix 7S, I would be happy if it would be available for this soon. Since the Fenix 7 also measures the watt values while running, can the app also be used while running?

Needs power and heart rate to do the calculations.

I’ve seen aerobic efficiency can be calculated by average speed / average HR for running but I haven’t implemented the average speed calc.

Sounds like you’d have the data to do the calculations.

I’m reasonably happy with the aerobic decoupling numbers it’s producing (compared to post ride analysis). After switching to exponential smoothing moving averages (due to memory limitations of Garmin IQ data fields). it’s a little more sensitive (to recent data) than I’d like. This means tuning the smoothing factors.

Haven’t seen it crash for a long time, despite my efforts to catch it out.

Hoping to reach public beta sometime this month.

Taken from Alan Couzens: The Science of Decoupling

Incidentally, a swing in the opposite direction can also indicate incomplete recovery via other mechanisms. In fact, over-reaching studies have typically found either decreased power/pace of ~5% for a given effort (e.g. Coutts et al. 2007, Jeukendrup et al., 1992), OR a decreased heart rate of 5% for a given power/pace (e.g. Hedelin et al, 2000). Therefore, ensuring athletes are within +/-5% of ‘normal’ power and HR is a good policy.

Here’s some output of modelling of the data field calculations , with the blue line representing what a simple moving average of normalised power / average HR produces where the warm up is 20 mins and the moving window 45 mins of data.

Here we are using a simple exponential moving averages with a similar window to the simple moving average. It estimates higher decoupling, but the margin in the reactivity in the reported decoupling is similar, even if it sometimes goes the opposite way.

Simple averages is what Friel came up with in the definition but I can’t do these in the data field due to memory limitations of that method on Garmin devices.

Here the simple exponential smoothing has a different smoothing factor which loses its reactivity and appears almost linear.

In the third and fourth graphs I have introduced a double exponential smoothing with allows for a smoother decoupling trend but also ones which react similar to a simple moving average. Note my double exponential is not as you’d find described in Wikipedia, but falls back to my degree level maths.

In the second example I’ve tuned it to be more reactive

This example is not a steady endurance ride, as I’m pushing up into high tempo for close to 4.5 hours in the outing being analysed. I was interested to see how the equations would trend aerobic decoupling in such an outing. I will look tomorrow at a steady endurance outing with the same equations.

The reported first half / second half post ride analysis reports 15% decoupling. Thus at the moment I report high decoupling in our shorter rolling window of 45 mins that excludes a 20 min warm period, then another 4.5 hours riding.

1 Like

Steady endurance today for 2 hours.

First half / second half aerobic decoupling analysis in software gives -2.52% , my IQ field gave -2.30% at end of ride.

Need to put my latest smoothing equations into the field; but looking good.

Got a 5.5 hour steady endurance planned for Sat. I’ll put the new smoothing equations in the field in time for that.

I’ll put this here to help explain why the final aerobic decoupling reported by the data field may not report the same figure as a first half / second half post ride analysis in software.

Here’s a chart showing efficiency factor over 4.5 hours. We capture the first half efficiency factor vs. second half efficiency factor averaged across those periods to determine an aerobic decoupling figure. You’re taking normalised power / average heart rate for each period but it’s essentially the same as average efficiency factor if we plot that.

Then we have the data field which excludes the user defined warm up period, measures baseline efficiency factor over another user defined period, then measures efficiency factor of a rolling period equal to the baseline period. It will be noted that for a ride much longer than twice the baseline , our baseline will be higher than the first half efficiency factor analysis in software, and that the final efficiency factor calculated will be much lower. That means that the field will report a higher final decoupling figure than post ride analysis that does first half / second half comparison. The field captured a baseline when you were much fresher, and then was tracking efficiency when you were much more fatigued.

If the baseline is close to half the ride duration then the aerobic decoupling reported tracks fairly close to what a first half / second half analysis produces. You might then say well you’ll just change the baseline duration depending on the ride. But I think that would remove consistency in your real time measurements. If I’m always using a baseline say of 45 minutes in my Z2 endurance rides then I know when I’m approaching 5/6% say, it’s time to head for home / call it a day. I’m comparing against the same baseline each time but I might be able to extend the duration before hitting that 5/6% decoupling.

You’ll note in the above graph there are two inflection points, with the decline in efficiency factor accelerating. I was doing some high tempo work to see what happens over 4.5 hours. Plus you’ll note the decline begins to slow near the end. That’s after I’d stopped at a cafe to refuel and get warm again. Shows that that fuelling and being warm help! But I was deliberately trying not to be optimal with that at the time, to see what the field reported. Not my normal training, but I’m interested in wondering if the field could also track the rate of decline and pick up on deflection points. That’s not how it looks on my Z2 endurance rides! But it’s nice to note that the decline doesn’t remain steady and can accelerate, just as many of us would have found out on our rides. This is why I didn’t want to smooth the decoupling too much, as it’s not linear, and you’d be underestimating your current decline from when fresh.

The other thing to note is that I’m using a double exponential smoothing on the field as simple moving averages exceed the memory available to the data field. Whilst the calculation isn’t exactly the same as a simple moving average, I’ve tuned the smoothing factors so it tracks fairly closely. This true at least on rides I’ve done up to 4.5 hours duration. The first smoothing factor is set to give a similar reactivity as simple moving averages and is calculated from the baseline duration, the second smoothing factor is just to remove jagged peaks whilst still tracking fairly well. Because it’s exponential decay with a half life you never truly remove old data out of the average, but it declines rapidly enough that it is close enough to a simple moving average over the duration you choose. You’ll see how close they track from my previous post.

With all the the above, I’m not a physiologist, but do have a BSC degree in mathematics, and a career in IT.

Hoping it’ll be ready for public beta in couple of weeks. I’m hoping good enough to be useful given what I’ve covered above. I’ve added the latest smoothing equations to the code and will be deploying the updated IQ field to my GPS today.

1 Like