Hi all, hoping a coach/someone with a greater knowledge base can chime in and enlighten me!
I have recently done some lactate testing with some interesting results.
Background:
35yo, male, 80kg, HRmax of 189, HRR of 139ish, estimated FTP of 300ish, recently completed a 42 min climb with ave power of 290 (tried to hold 300 so definitely wasn’t all out effort) and ave HR of 176bpm. In the past, for such efforts, 99% of the time I have averaged a HR or 176 - therefore assumed it was my LTHR or close to it.
I have mostly been training off power and the standardised power zones from estimated FTP with disregard to HR. Since listening to the Fast Talk podcast, I have taken more notice of HR and tried to limit myself at times to stick closer to estimated HR zones (%HRR utilised recently, however the top of Z2 now needs modifying after this lactate testing).
Prior to this lactate testing, I was running off the following Z2 zones:
166-227w
133-146bpm
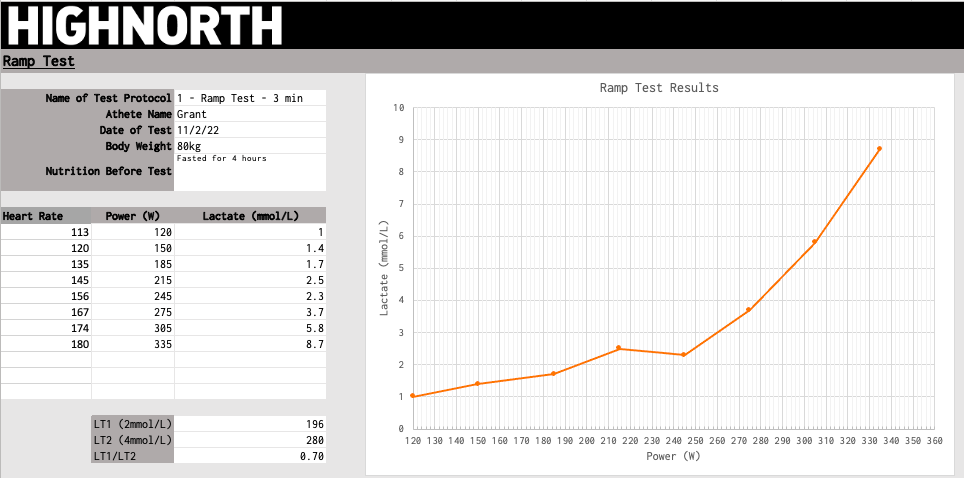
After interpreting my lactate profile, it suggests:
Aerobic threshold of 196w (at roughly 130bpm)
Anaerobic threshold of 280w
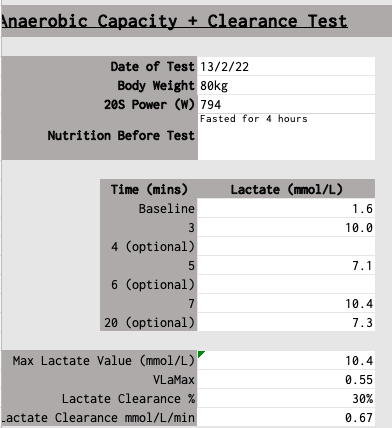
VLaMax - 0.55%
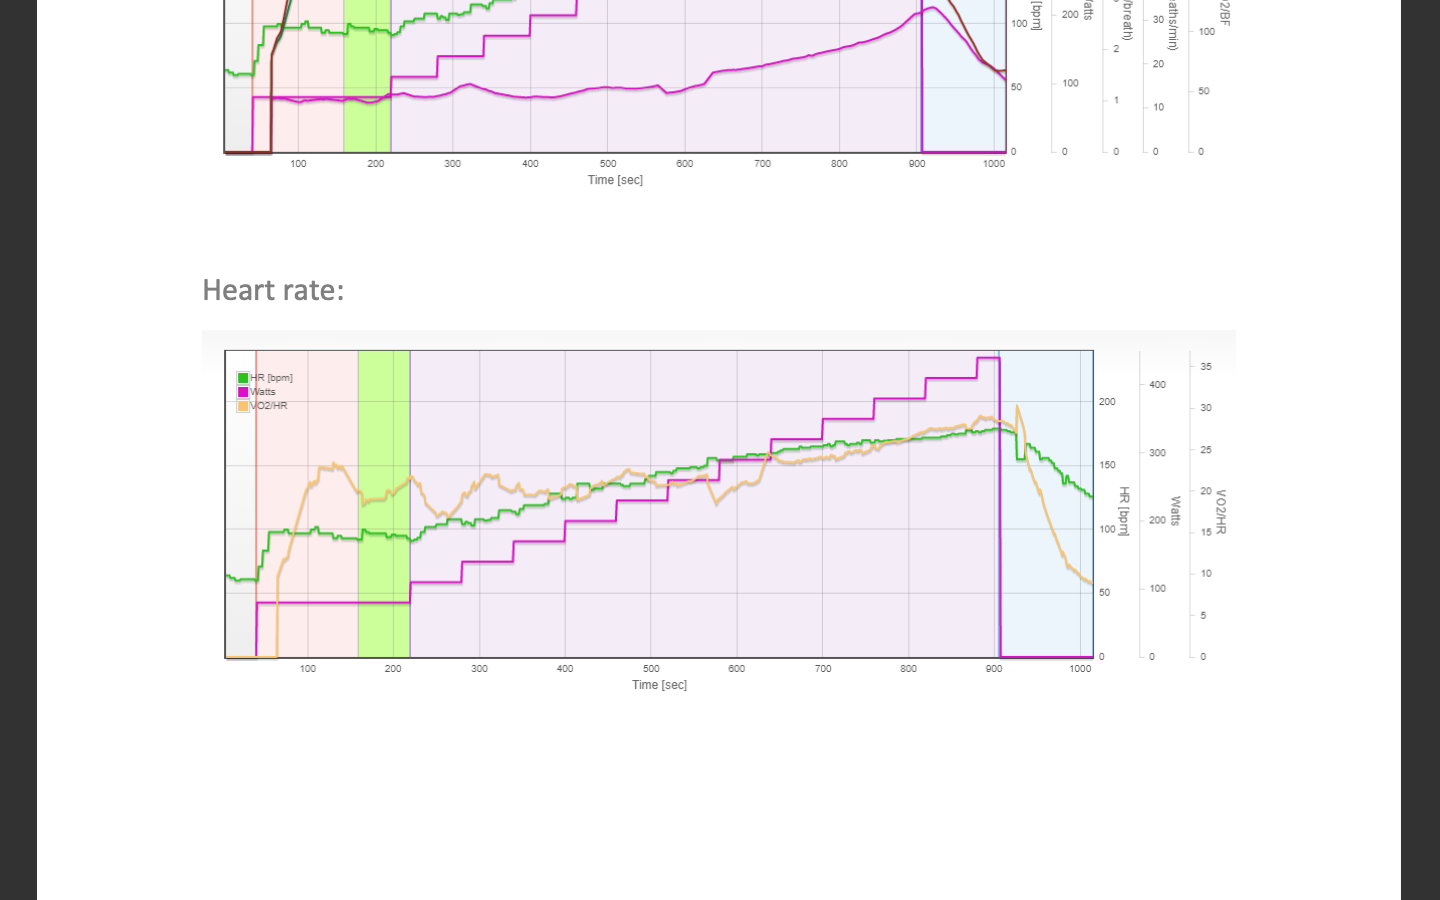
I have now completed a MLSS where my lactate was steady at 3.6 during a 270w block, but jumped from 4.7 to 6.4 during the 280w block. So best estimate would be MLSS of 275w? During this block, I had an average of 166bpm. And during the 280w block, I averaged 172bpm. Is 166 therefore my threshold HR? (interestingly, this is the figure that training peaks estimated my threshold HR to be on a recent ride).
So I now have a few questions:
Am I best to set my “FTP” at or around the 275w to concur with my MLSS, even though my possible power production indicates an estimate of 300w FTP. It should also be noted that I am still able to complete all workouts with FTP set to 300w - aka long threshold sessions, 110-120% sessions and 30/30 sessions at 130% etc etc.
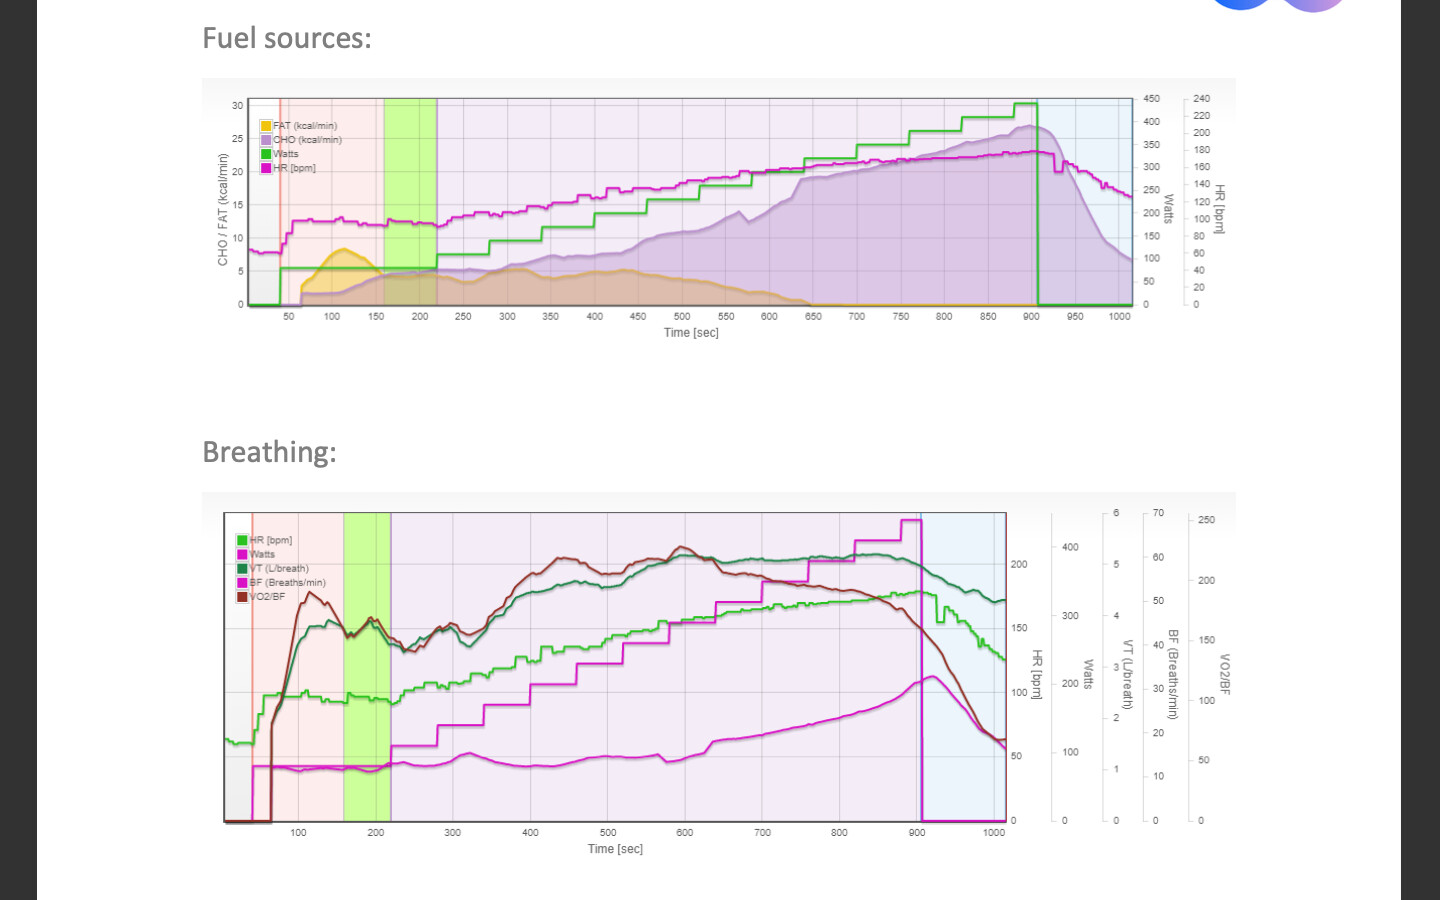
Does this just show that I am reliant on anaerobic metabolism to reach the higher number during an FTP test vs what my physiology is actually doing? I have done a PNOE test in the past that showed that I have poor fat oxidisation, high carbohydrate utilisation and highly anaerobic - which is unfortunate as I don’t even have a good sprint. I assume that high reliance on anaerobic metabolism doesn’t always translate to high sprint capabilities etc.
What would be the advantages/disadvantages of setting it to 275 vs 300 (aside from the demoralisation to my ego). And vice versa for setting it to 300 instead of 275.
– Hypothetically speaking, would you see more increases in fitness/adaptations by training to your physiology vs training to your actual capabilities regardless of how the energy is produced? I can see benefits to both.
How does one best set HR zones? Assuming aerobic threshold HR is 130 and lactate threshold is 166, Do I just make these the middle/high end of those two specific zones and let the rest of the zones filter out from there?
If you have a lot of data using the mFTP and that model for tracking the training stress, I would likely leave it that way, and use the testing as a way to monitor that change in your deflection points.
That would be likely.
Can you access the raw data (not the report) that came from your PNOE test, it should be available upon request. If you can get that I can get better answer to this question, or a more individual one.
I would use the heart rate, at the lactate deflection points (or 2 and 4 mmol in your case) as the ceilings for each of those zones.
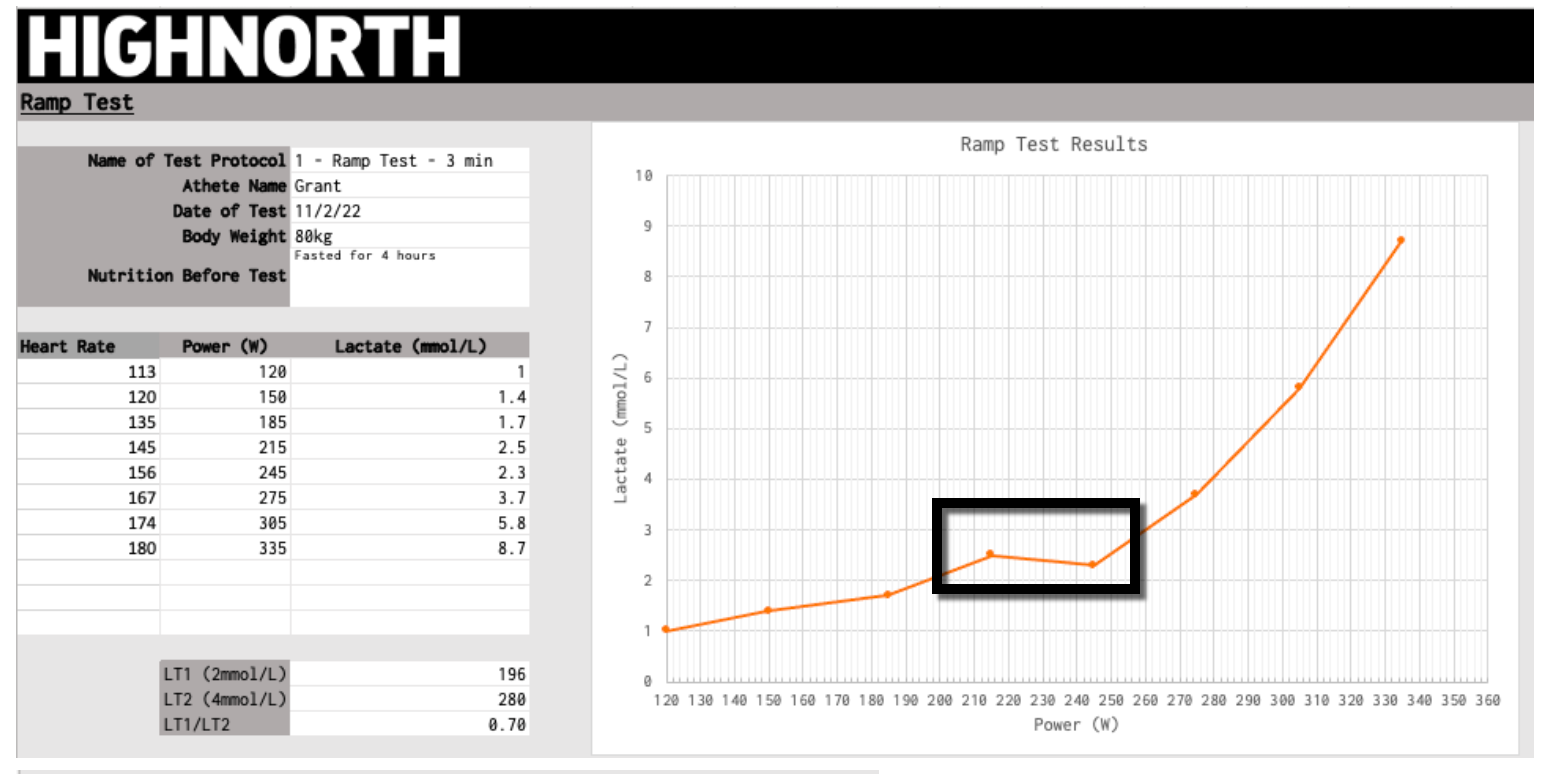
Agree with your assessment. Its always tricky in a situation like this. Meaning a lower reading after a previous reading. With experience you will know when you’ve got a potential “bad” reading, so you can retake it immediately.
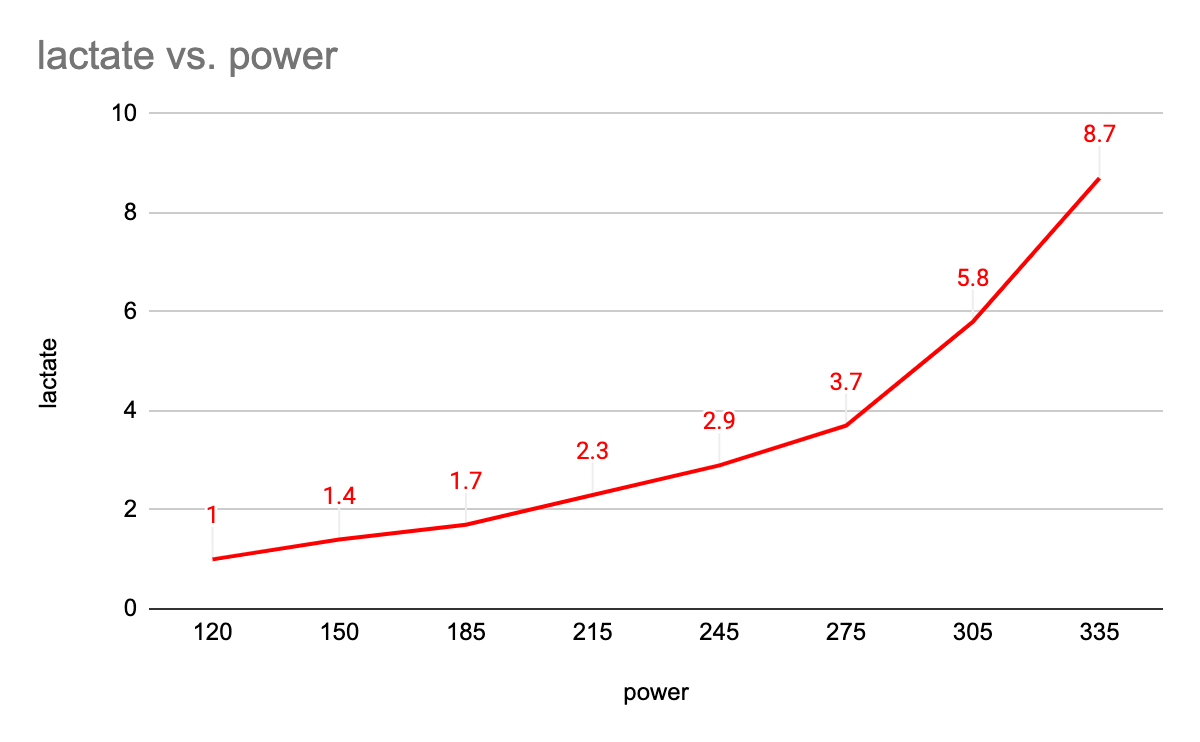
After modifying the lactate readings at 215w and 245w, as you have suggested, it shows that 2mmol is around 200w vs the 196w, so a small change.
Am I able to do a step test smilier to MLSS testing in order to find out my true AeT? Aka warm up, 10 mins at 190, 10 mins at 200, 10 mins at 210 etc etc and see at what point/Hr I am no longer able to stay under/at 2mmol?
This was the first batch of testing I have done so it’s all a learning curve.
I guess that it comes down to what I want to achieve from training. If I want to reduce VlaMax in order to shift my AnT to the right, then training at the 300W ftp will be counter productive. Just because I can do the workouts at that level, doesn’t mean I will achieve all the training benefits if in comparison I dropped it to the 280w suggested by 4mmol/AnT.
As for the heart rates, I assume that once I find true wattage values for 2/4mmol, I can then do say a 10-20 minute effort at those wattages, and average the stabilised portion of HR in order to correspond Hr to lactate turn points?
I would be comfortable putting your FTP at 294, based on your 280 watts at 4mmol. My personal experience with mFTP is, that its usually much lower. FYI I use WKO5 on top if TrainingPeaks for my athletes and use that mFTP as a reference.
I personally think you aleady have it at the deflection point of 135 heart rate and 1.7 lactate and 185w. I am not a believe in 2 and 4, I use the deflection points.
Then use those deflection points as ceilings.
In a recent other post, I gave a few examples of fatmax relative to LT1.
Hi Grant, I’m a little late to the game but wanted to add my thoughts to your questions.
I wouldn’t try to align FTP with MLSS. If you found that your lactate was stable at 270w, and then changed at 280w, I would leave MLSS at 270w and look at WKO or do other testing that would give you a reasonable FTP number. Related to #2, the ability to complete all workouts with FTP set to 300w would suggest to me that you rely heavily on anaerobic metabolism as you suggested. Aligning that with your lactate curve, the curve is upsloping from the start, also suggesting a high glycolytic flux, or just a poor fat oxidation at low intensities.
(or really #3) My take on setting 275 vs. 300 for your threshold power is that if you’re setting ranges by %, then you would get some large differences depending on which way you went (higher or lower for threshold power). Assuming you select an AT of 300w, without doing anything to your AeT, then you would still complete your HIIT workouts with relative ease due to your more anaerobic nature. FTP of 275w would lessen the strain from those HIIT sessions (is this what you want? how does that fit into your goals?).
I set zones using AeT and AT. With the additional data you have from PNOE you can certainly tease out additional information. I’m sure if @steveneal is running your workout through his software he will have the graphs to highlight this, but you can tell by the changes in lactate where to set that mid-range.
According to PNOE (taken December 2020) my fatmax was around 100BPM - so really low.
I’ve seen/read a lot of different opinions on how on physiologist identifies AeT and AnT compared to the next.
Would be interested to hear both of your opinions?
Some say AeT lays at the initial upturn from baseline lactate? Others say; when lactate has risen to 1.7mm; when lactate has risen 1.0mmol from baseline; then others correlate it to changes found within ventilation and respiration.