I just completed my Xmas training camp ! 
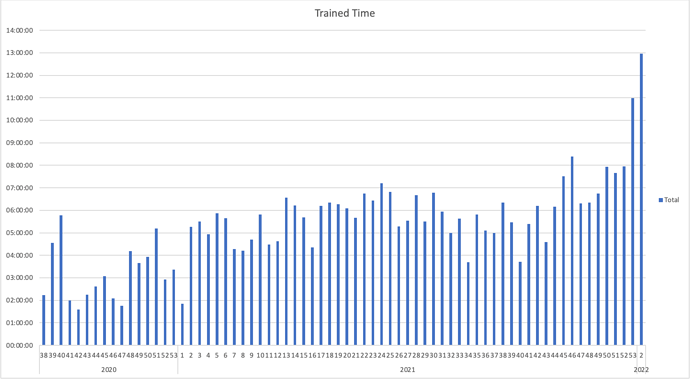
I trained 5 days in the first week and 6 days in the second week, 2 sessions per day. The volume increase was quite…huge.
Interestingly enough, I managed to do it without visiting the hospital. Halfway during the first week I felt very fatigued, but sticking to Z1 while cycling solved that.
Compared to my usual weeks I changed the intensity distribution, assuming I couldn’t output this volume with the same distribution.
Therefore I decided to go for a skating session every other weekday in the morning, and a HR Z1 cycling session in the afternoon. On the non-skating days I performed two cycling sessions, mostly in HR Z1.
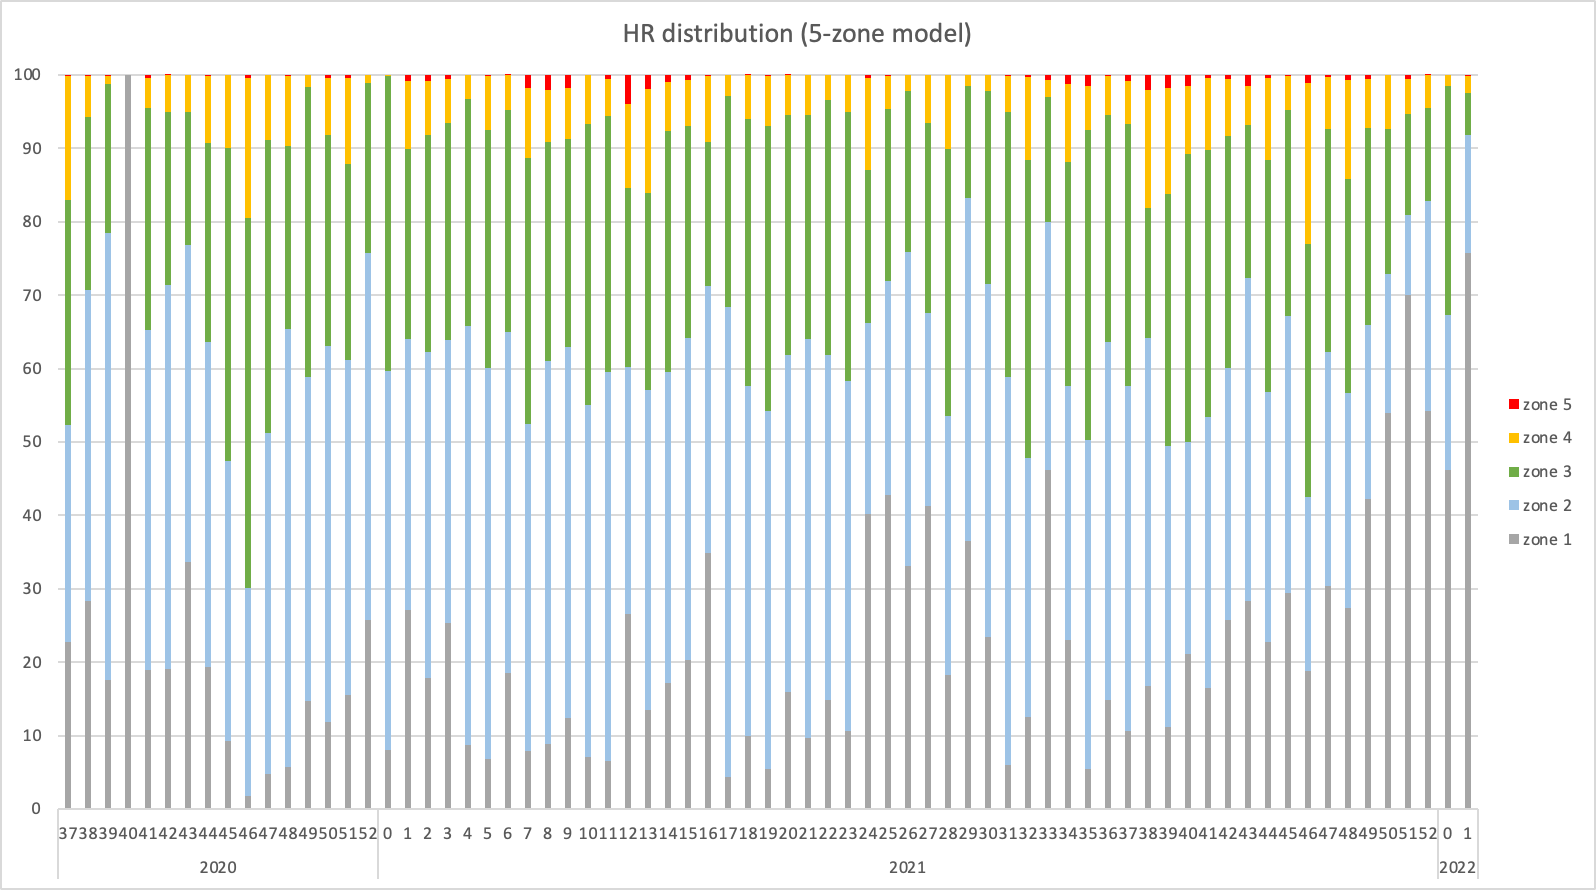
The HR distribution (5-zone model) turned out to be:
(let’s not discuss SQL/Excel weeknumber dramas, the last 2 weeks matter)
As the graph shows, the percentage of time in HR Z1 increased significantly. This was purely the result of the cycling, as I spent practically no time in Z1 while ice skating.
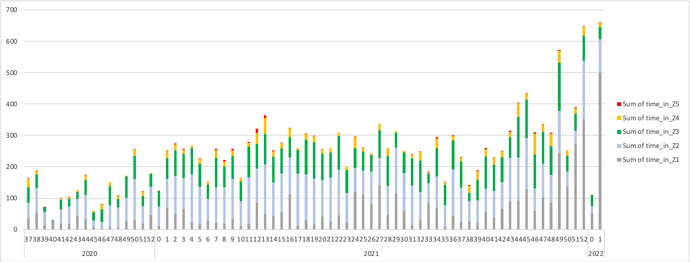
The time-in-zone graph shows the exact same thing:
(week 0 is actually the first day of week 1)
I found it interesting to see that I cycled more time in Z1 than the total training time in the weeks before.
I spent most of 2021 on skates (non-ice), which explains why my percentage of time in HR zones above Zone 1 decreased during the camp.
The lack of HR zone 5 has two reasons:
- I focused on strength development while skating (sit low, keep force high but power low)
- the volume increase probably fatigued me to the state were zone 5 was not really in reach. In fact I spend 2 minutes in zone 5, but it is too short to show in the graph.
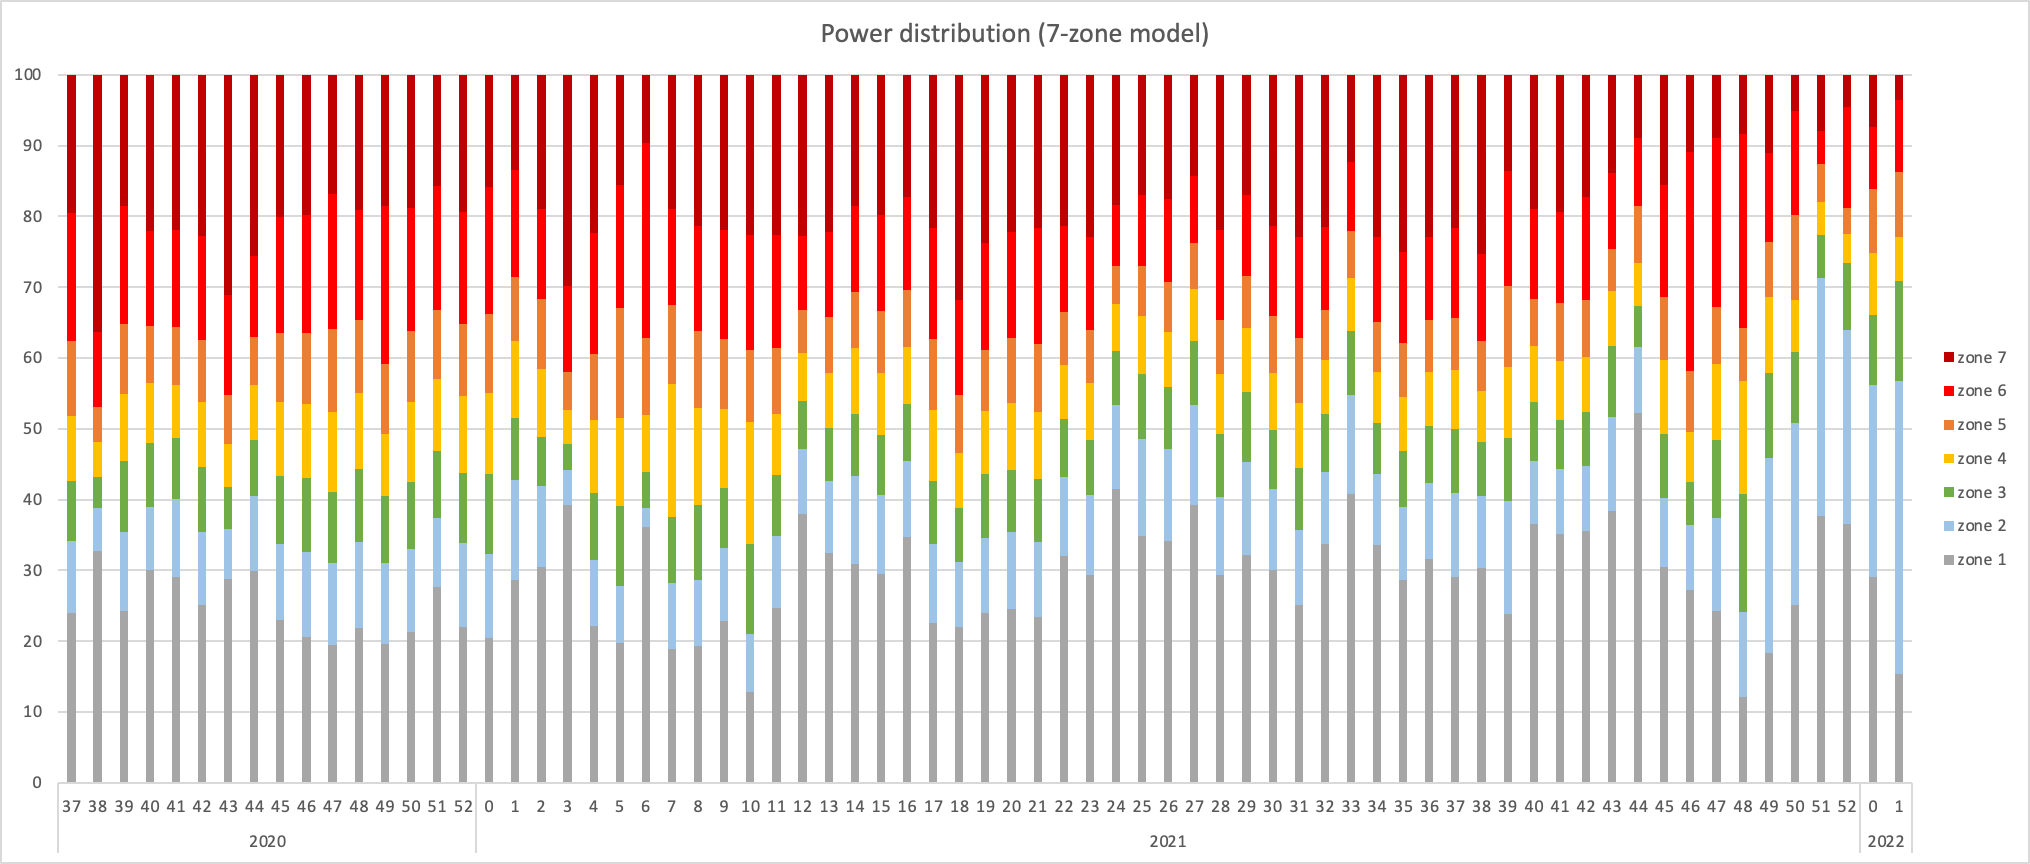
The power graph seems in line with the above: more ‘endurance power’ and less ‘above endurance’.
The time-in-power-zone graph:
The increase in Power Zone 5 is the result of some tempo VO2max blocks while skating. The reduction in neuromuscular power is probably best explained by the fact that power measurement outdoors is done through GPS speed, which leads to high spikes.
Can we talk results yet?
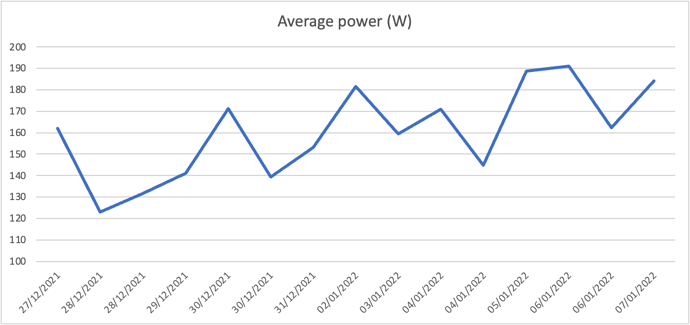
Well, there was a trend in HR Z1 cycling power:
The zig-zag nature of the graph is interesting. The power output in HR zone 1 after a skating session was higher than any of the sessions on the next day. Can somebody explain that?
I should add that I never cycled this much so it could also be a simple adaption to cycling.
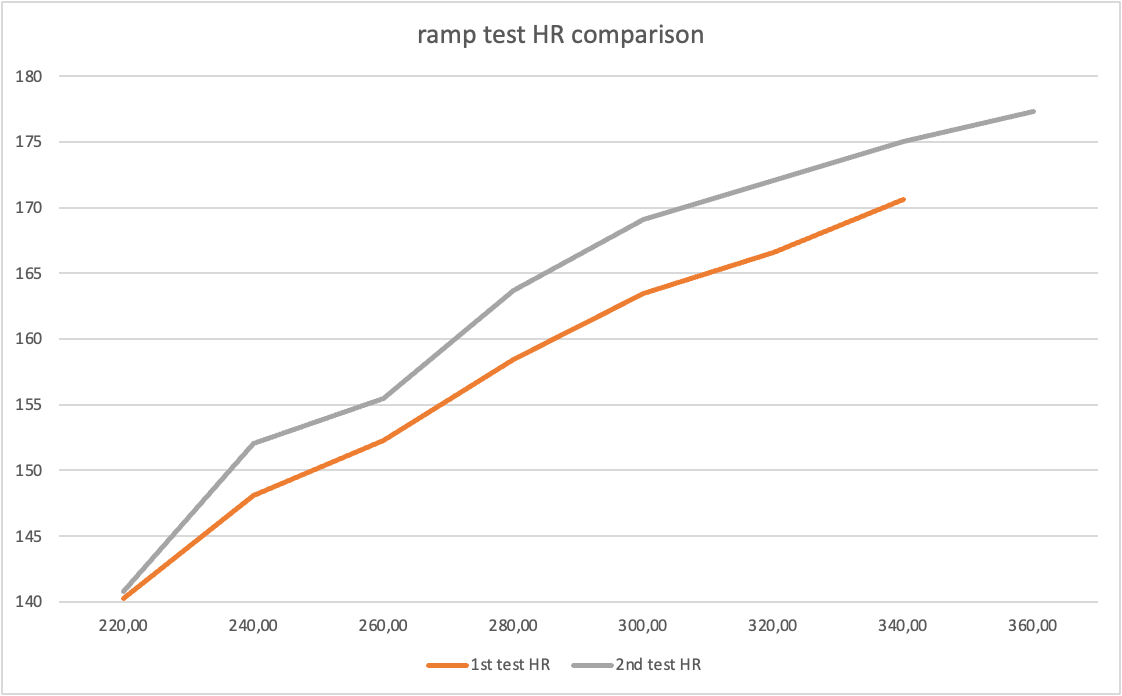
I have a ramp test planned for Sunday, and if the weather permits, an 8 km time trial on skates for which I have years of reference data.


