This looks interesting.
Here is what the graphs are showing with the examples with tried, thanks @shawnfife for taking some time out of your training to do this.
The Moxy is showing what is happening at the muscle, so there aren’t really many differences with the decoupling, but there are some small, interesting differences.
These are just statements as I don’t see too much difference, just subtle ones.
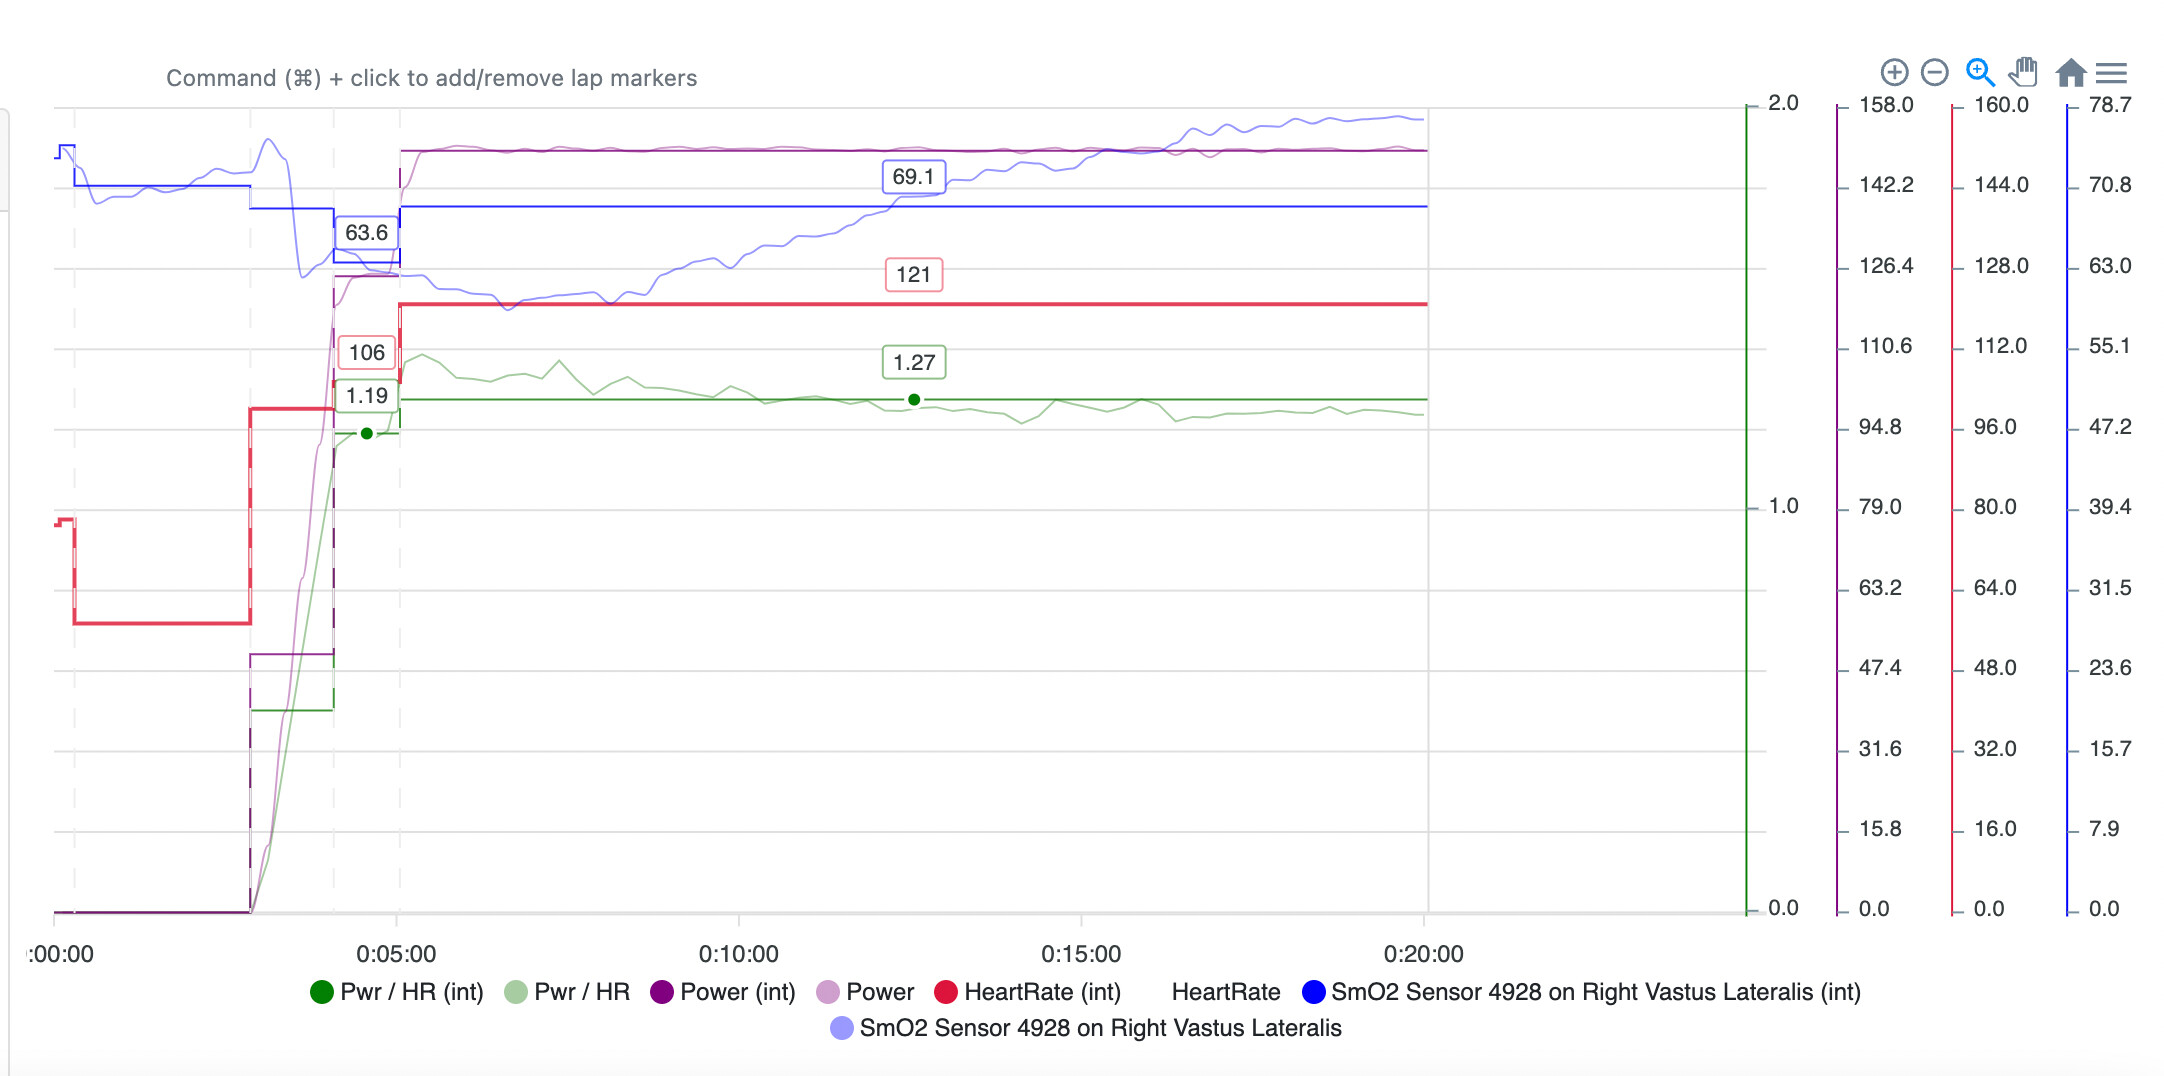
Below is heading straight into the wattage as you did. Entire Interval.
And below longer progression into the wattage.
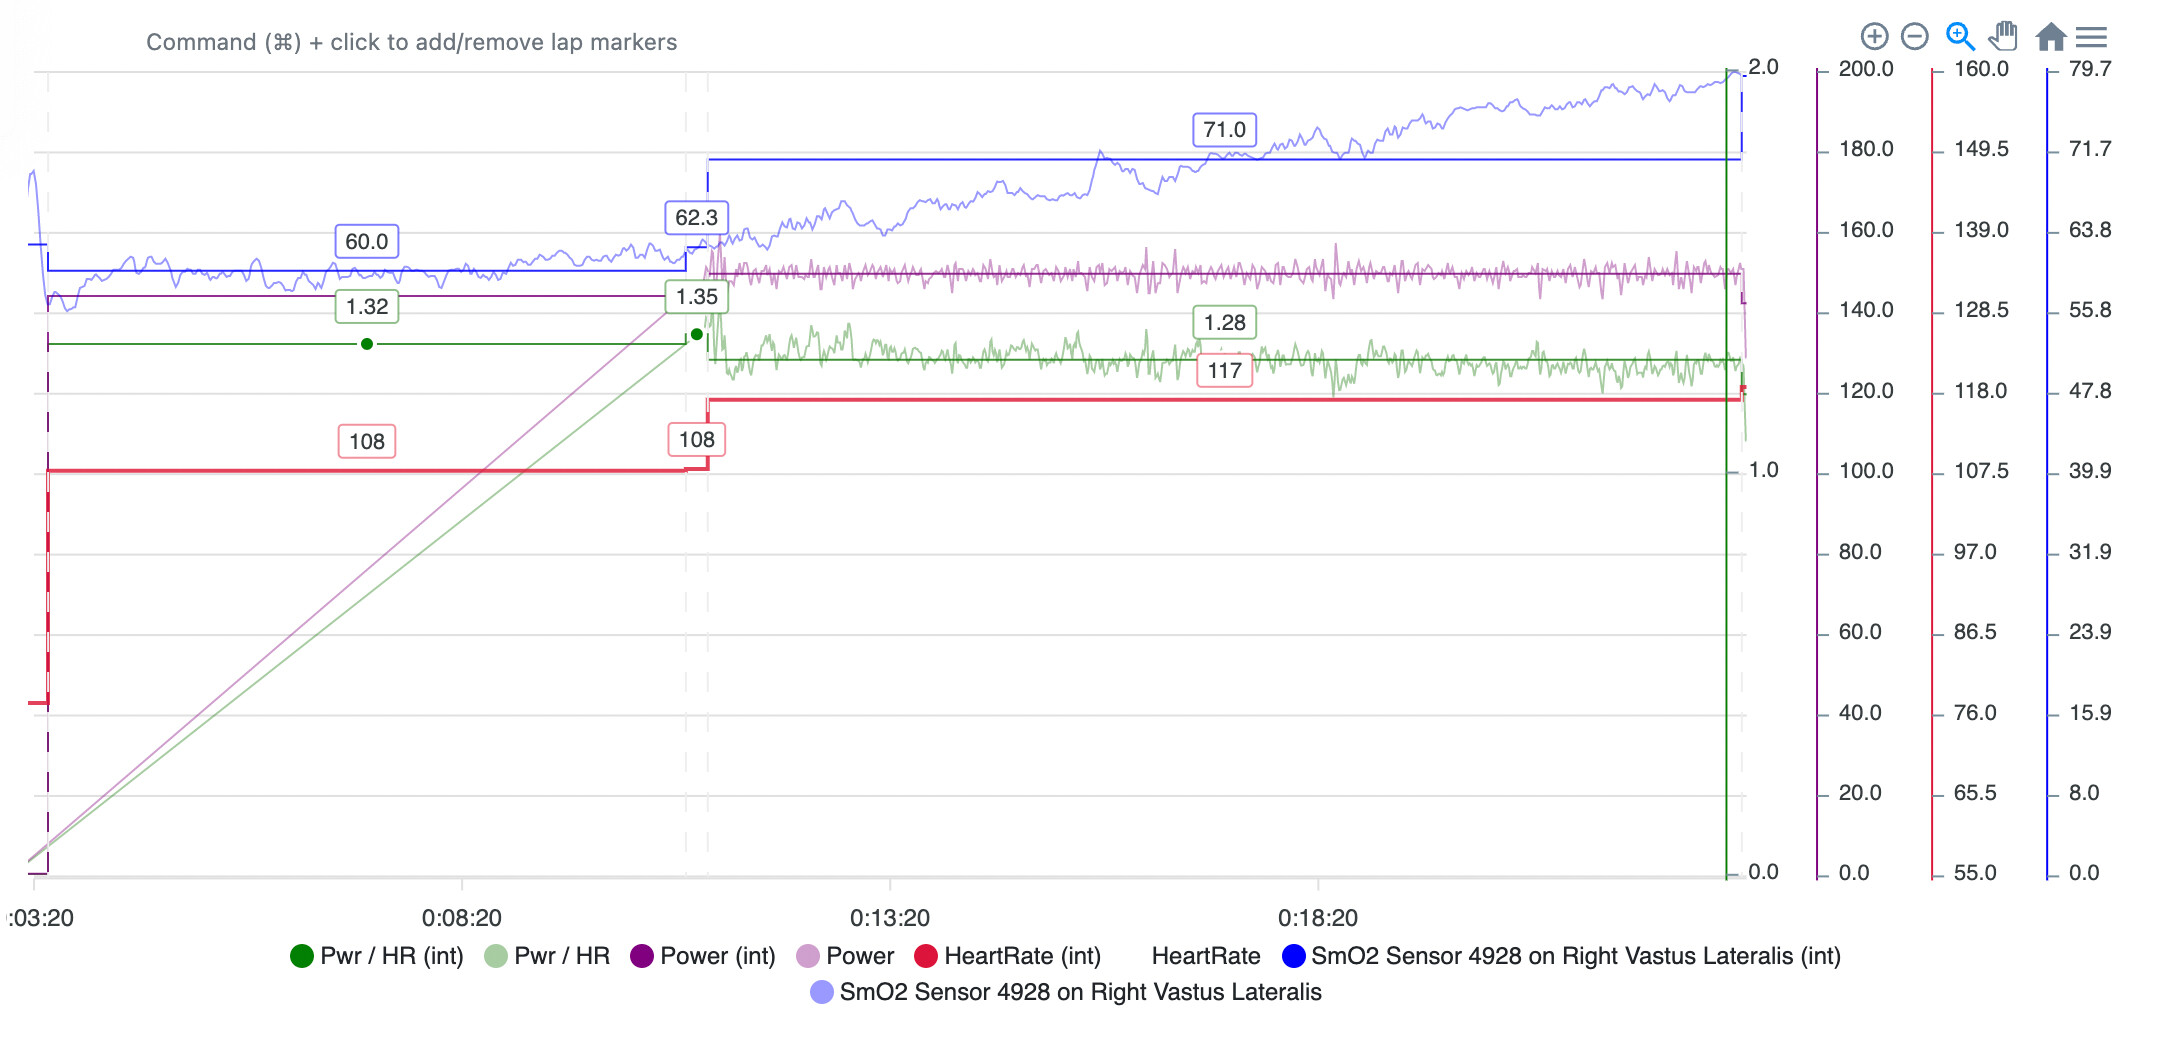
Few differences.
| Entire Interval | |||
|---|---|---|---|
| Straight into Wattage | Longer Progression to Wattage | ||
| Avg HR | 121 | 117 | 3.3% lower |
| Pw Hr | 1.27 | 1.28 | minimal difference |
| SmO2 | 69.1 | 71 | 2.7% higher |
| Interval broken into 1m steps | |||
| Smo2 min max delta | 17.7 | 18.9 | 1.2% higher |
Not relative to this post but it does show one thing I always try and teach for a warm-up.
Below is an overlap of the smo2.
The blue line represents the more gradual approach to the 150 watts, the pink line straight into the wattage.

I really like the smo2 trend of the gradual warm-up into the 150 watts.
During the other protocol, you can see the immediate drop in smo2 as the wattage goes from 100-125-150 watts.
The starting smo2 of that session was higher and could have remained higher during a better more gradual warm-up, in this case they both end up at the same level but this didn’t need to be the case.
This is a great example of how taking a very gradual approach to warming up is beneficial.
I find that it takes a minimum of 20m to reach peak saturation when done very gradually.
Once the peak saturation has been reached using this method, then you do some intensity with Stopping during the recoveries to gain even higher saturation prior to a workout or event.
ONE OTHER THING TO NOTE IS IN TRAINING PEAKS THE PWHR NUMBER FOR THE SESSION THAT GOES STRAIGHT INTO 150 WATTS WAS 4.64 AND FOR THE MORE GRADUAL APPROACH 1.95 SO USING THOSE METRICS THE MORE GRADUAL APPROACH SEEMS TO GET A BETTER RESULT.
1 Like
Many thanks to @steveneal and @shawnfife !
I really though of the 149 watts as ‘to easy to warm-up for’, but I guess this proofs me wrong.
The difference is clear and could very well explain the inverse decoupling.
Based on these results I would like to try another 149 W effort, but with a warm-up and see if I can achieve a rising & steady HR instead of the ‘up and down’ curve.
For what it is worth, the longer and more gradually effort had a reduced RPE.
Being in ERG mode, I felt like I kept having to consciously slow my cadence down, to remain steady. My legs felt lighter and wanted to spin more.
1 Like
@shawnfife thanks for the feedback and I would expect this is what you would feel.
The other piece is to make warm-up even better by…
start at very lower power
once the smo2 stabilizes raise the power slightly, smo2 will drop and re-stabilize higher than before, if so then raise power again, if not wait a little longer.
Once you reach a plateau of power and smo2 then intensity needs to be done to increase smo2 to max for that day.
If it doesn’t respond…likely not a day for any internsity.
Thanks again @shawnfife hard for me to do this stuff at the moment or maybe forever…not sure.
@kjeldbontenbal fyi
1 Like
I am at a transition in between seasons right now.
If there are any other little experiments to be done , I am happy to help out.
3 Likes
Just found another great explainer, which clearly stated ( at 9 minutes into the vid): < 0% decoupling = need a better warm-up / environmental conditions cause this number

The content of the vid is backed-up by a few citations at the end. Good stuff.
1 Like
@kjeldbontenbal great find. I will try and demonstrate or get @shawnfife to do it for me how to warm-up using a moxy. Won’t be on my computer much today but will be back tomorrow. Need to unpack some more boxes today!
I like to call this your engine running cold and then later on reaching operating temperature. I think it takes a while for your internal physiology to get up to speed with the exercise demands placed on it from rest.
I if I go out for a hilly ride, the first hill always seems harder. Subsequent hills and warmed up my body is primed for what’s to come.
If I do intervals on my turbo with the aim to sustain around 90% max HR across an interval set. I find I can sustain higher power for that HR if I’ve done a 15 min warm up before the first set. I initially would do 5 min warm ups which I found wasn’t enough.
After our conclusions here I greatly reduced my power output during warm-up. It looks like my HR curve is longer parabolic. #nailedIt
2 Likes
@steveneal Could there be more to it than just respiration rate?
I performed two structured sessions, one yesterday, one today.
HR cap: zone 3
Focus: steady as it goes
Respiration focus in section 3 (forced exhale on push-off)

There does not seem te be a relationship between the respiration focus and performance.
Yesterday’s session had the classic downward trend in HR and an increasing efficiency from half-up on (orange is HR, blue is (stress/strain)*100)
Today showed a more steady HR and increase in efficiency during the session.
Weather conditions were equal.
The biggest difference i can think of: yesterday’s session was after lunch, today’s session was before lunch.
Yes I think there could be more to it, but to be honest not really sure other than what I have already discussed.
Revisiting this topic:
I’ve been doing longer sessions lately with a zone 3 (out of 5) target on track. Which means there is a bit of W’ utilisation in every corner.
I’ve noticed that there is a point in time where HR and speed stabilise.
In a fatigued state HR stabilises much earlier into the session, but 1 zone lower than intended.
So besides the effects of the warm-up protocol, it seems that TYPE II utilisation / glycolysis impacts the HR response.