Atom boom classic 110mm xx-firm.
When you have a decreasing pace and heart rate like this, I would say it could be muscular fatigue, unless there was a loss of focus during the session.
When you have the example of decreasing heart rate with stable pace it would be an improvement of the respiration as session goes on.
If you think of Heart rate, Respiration, Muscular as different systems, there will be differences daily so using the decoupling can only be done when you know what causes the numbers to be different.
2 Likes
Apologies if you have explained this in another thread, but how exactly is power measured?
@cogburner accelerated mass + rolling resistance + wind resistance (weather information combined with gps speed and heading) + elevation change.
On the indoor track it is derived from the lap time.
Cool. What I thought but just curious. Maybe one day someone will perfect a footbed force plate.
Since I am a physicist by day I thought it would be cool to calculate how much you would expect to speed up due to a decrease in rolling resistance due to more pliability in the wheels from an increase in temperature. However it is nearly impossible to find temperature curves. I suspect they are U-shaped just based on my own N=1 sensations with polyurethane roller ski wheels, but this is just a guess. Because you have extra firm (hard) wheels and are on a track, this effect should be less than I initially thought, though.
Really all I can say is that this is just another variable that needs to be controlled for if you really want to get to the bottom of this. Quite frankly there are many variables that could easily influence this that I can think of and that have been brought up, so it will be hard.
Echoing Steve’s advice, over time you might be able to tease out what it definitely is or is not. I think performing very controlled sessions on ice, with ample time after a meal and no caffeine, at the same time of day, making sure you are holding good form the entire time and are not strained doing it, etc., is the only way to start to narrow down the relative contribution of each factor. Definitely keep us updated and sorry I couldn’t be more help!
@cogburner: once a physicist, always a physicist 
I have no clue to what extend the wheels warm up, but I also never hear anybody talk about it nor did I notice it myself.
There is also a lot of wind cooling of course. An IR measurement could solve this question. But if you are going to invest time in something like that, i prefer you design that force plate 
1 Like
@kjeldbontenbal If you are curious feel your wheels immediately after stopping - they might be warmer than you think! If there is no noticeable difference this can definitely be ruled out.
Excellent thinking about the wind cooling!
There is a footbed power meter out there, RPM2, although it’s very hard to find any reviews or information on it…
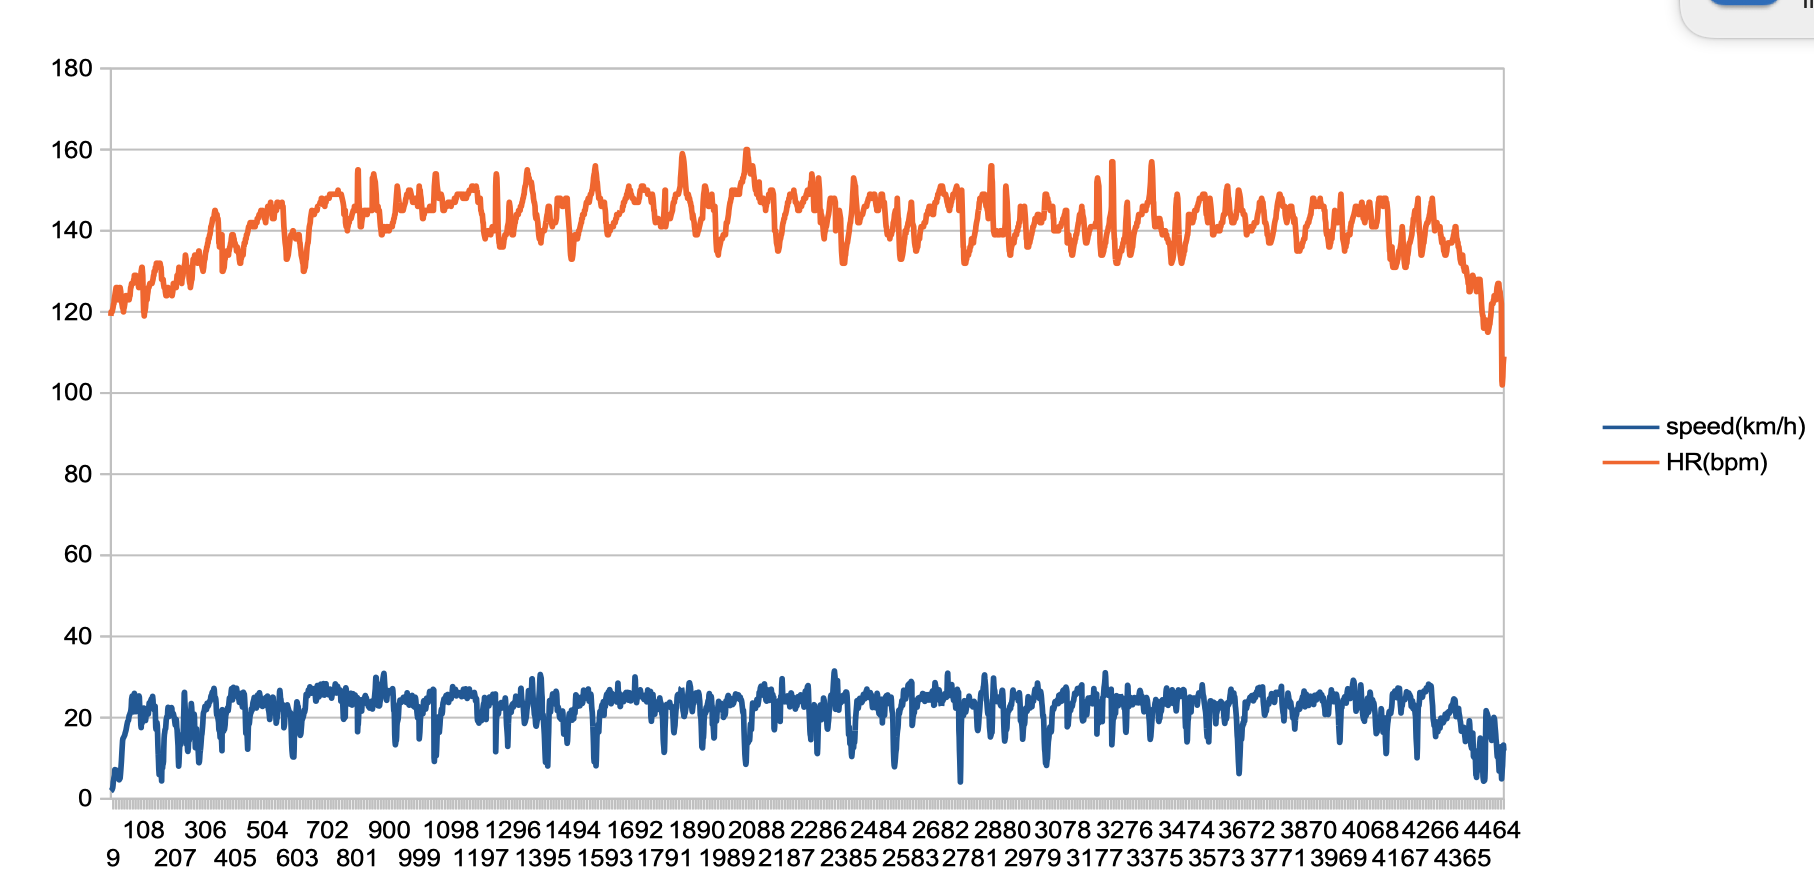
Today’s training was the same duration as the other graphs I’ve showed, but without the intervals. Just a steady zone 2 attempt.
The decoupling is less prominent.
I wouldn’t dare to conclude anything, but i am thinking about:
- deeper breathing not initiated because there was not bigger oxygen demand
- less heart fatigue
- less muscle fatigue
- glycogen use better spread over the entire session.
1 Like
This time performed a HR zone 1 recovery ride at a steady 149 watts using the smart trainer.
(approx 55% of FTP).
- nose breathing all the time
- no preparation in nutrition
- drank 500 ml of water, approx 150 ml every 15 minutes
- no change in respiration rate
- rode for 1 hour
- ‘big’ HR spikes are due to ‘shifting position’.
- the most noticeable spike about half-way was due to ‘riding up-right, no hands’
- about half-way i temporarily dropped my cadence from 95 to 85, noticed a drop in hr.
- all other variations in HR seemed to be related to my thought process (seriously)

So what can we conclude / assume from this? @steveneal and others
@kjeldbontenbal How quickly did you go to 55% of your FTP? I see heart rate and cadence on the graph but no power.
You mention nasal breathing and no change in rate…but is there a change in the depth of your breath at this rate during the session?
Is is shallower in the beginning trending to deeper as you go?
I started at 149 watts right from the start and kept it constant.
I paid attention to my breathing and did not notice a pattern of change.
@shawnfife would you be able to do me a favour with moxy on.
Could be done before any workout.
1m 100w 1m 125w 15m 150w
Another session, take 10m to gradually go from 100 to 150w then ride 15m at 150w.
You can share the fit files on here or just tell me the dates you do them and I can get from training peaks.
I can do those tomorrow, First in AM, and Second in PM.
Do you want those done in Erg Mode?
Work outs done. In trainingpeaks.
2 Likes
@shawnfife I would normally say no but let’s use erg mode as that seems to be what was done in this thread.
I figured you would say that. I can re-do the tests over the weekend in slope mode as well.
Let me graph them first and it is likely best that we do what the other member was doing to try and mimic the situation.
Was there any differences visible already?
Meanwhile I did some more Googling and found that others use the term ‘negative decoupling’, probably because of the decoupling metric in TrainingPeaks / Trainerroad that becomes a negative number when this happens.
Many use decoupling as an indicator of aerobic fitness, with values lower that 6% indicating a good aerobic base.
A negative number would then mean that your aerobic base is very good. The training implications would be:
- retest for FTP
- increase overall wattage during training
- move on to more anaerobic stuff.
In the 149 watt steady ride I shared here I had set my FTP to 270 watts. Because that is a value I can easily hold for 1 hour when skating in HR zone 2. A recent ramp test on the smart trainer, although not carried out perfectly) revealed a FTP of 325 (80% of 1 minute at 405 W). That value has strong correlation with my power duration curve in a 1000m sprint skating event.
This would mean that my 55% of FTP should have been 178 W. I can test again to see what the decoupling is at that power level.
However, 149 W felt good for the purpose of the recovery ride. (-> focussed at recovering the leg muscles, not the heart).
My skating performance indicates that i need to work on my peak power and sustained ‘high-power’ to improve lap times. This correlates to the negative decoupling (aerobic base is fine) and my perception that high power (high cadence) is easier for me on the bike that high force (low cadence).
I can image we can confirm these thoughts with proper VO2max and lactate testing. The hypothesis would be: high VT1 correlaties strongly with negative decoupling.
Or put simpler: all well-trained (or better) endurance athletes experience negative decoupling during recovery rides.
1 Like