I want to better understand the causes for inverse decoupling.
With that term I refer the effect where heart rate is lower towards the end of a training session for the same power output.
Any ideas?
I am a speed skater and often notice that when I try to stick to zone 2 (out of 5), my heart rate jumps to zone 3 with only little (perceived) force. This happens the most at the beginning of a session. Towards the end I can apply much more force for the same heart rate. And more interestingly, the heart seems slower to respond to short power peaks.
A while back I found one cause which was dehydration. But with that solved, I still observe the same effects.
I often see that too in my z2 long rides.
More often than not I’m drinking 1-2 coffees before them, it probably has an impact on HR that tapers off slowly as the ride progresses.
Could maybe also be linked to blood sugar, I find my HR during those long z2 is ±10 beats lower when using a lowish carb approach. Linked to glycogen stores/fuel availability maybe?
2 hypothesis but no real answers
It’s an interesting question.
I tried to influence HR by using similar things, but no strong correlations found. I also suspect glycogen availability and therefore ‘easy power bursts’.
I’m also interested in hearing what the coaches say on this topic.
However, I believe what you are describing has been referred to as ‘fatigue induced heart rate depression.’ A similar physiological response occurs when an athlete has built up chronic fatigue over time and heart rate does not rise with increases in intensity during a work-out. The coach usually says knock-it-off and take a rest day in order to recover and shed fatigue.
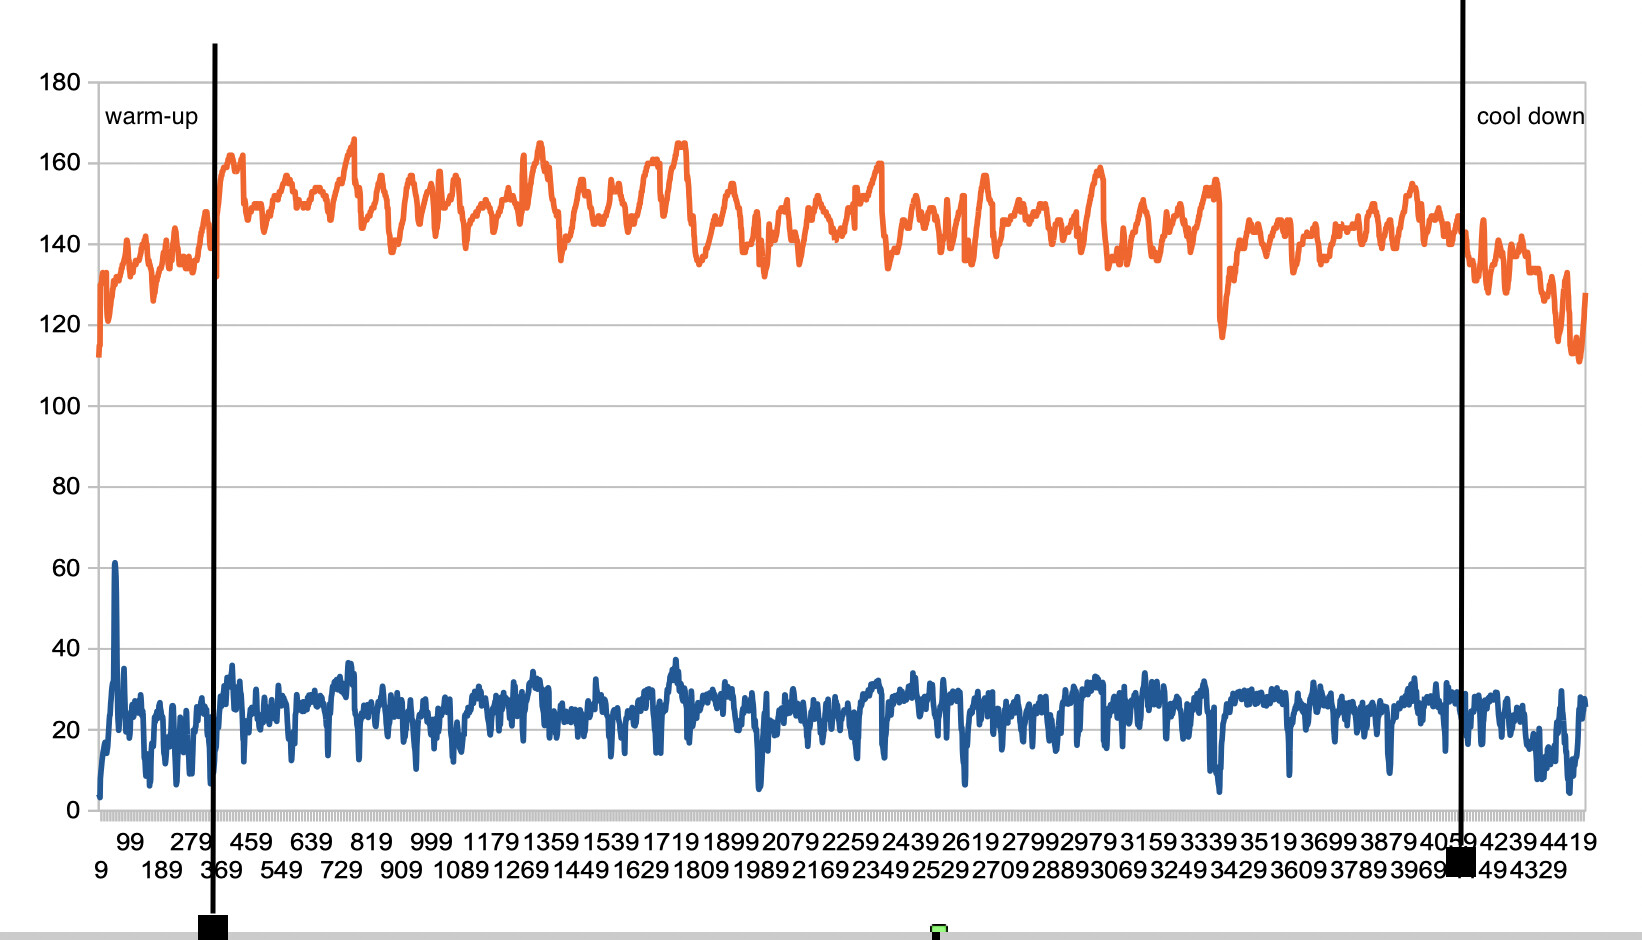
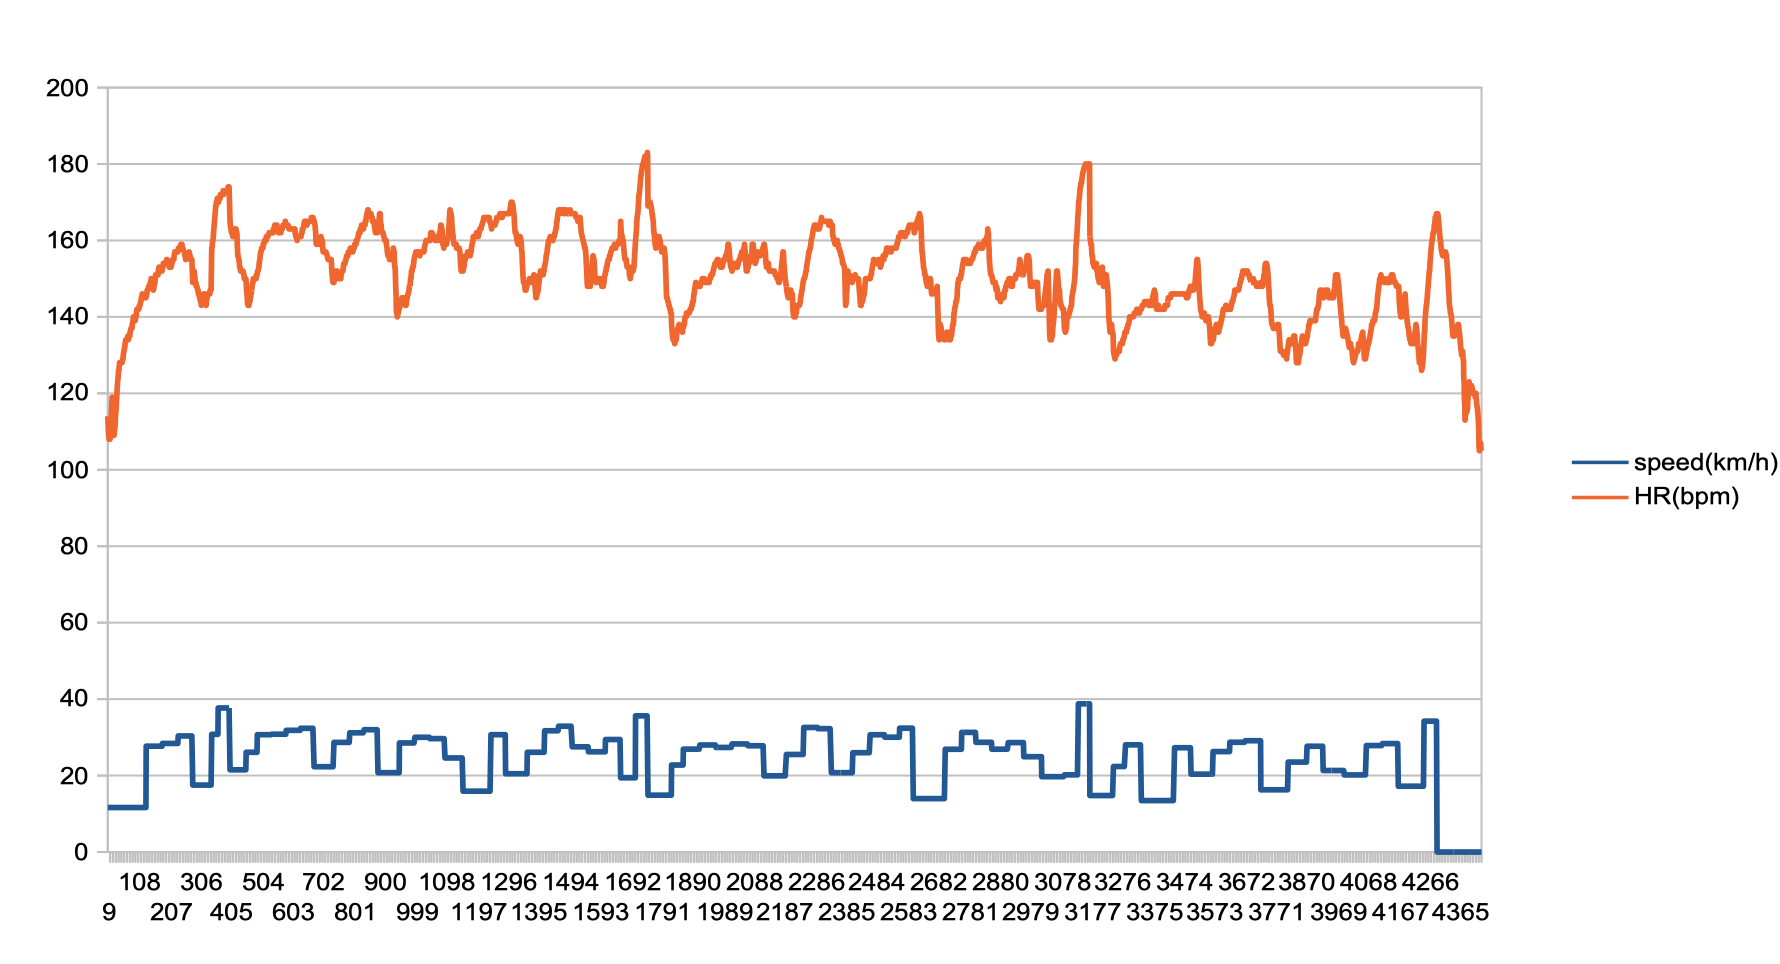
Here is a great example of today’s skate with 80% targeted at zone 2 and 20% at zone 3. (see the peaks in HR)
I found it interesting to see that the decoupling starts right after warm-up (the first 10%)
I don’t think the respiration rate changes @steveneal. Never actually counted, but I do occasionally try to nose breath in zone 2. That seems to work better towards the end of the training which might indicate deeper breathing.
I’ve set a reminder for tomorrows training give the respiration rate attention as well as the depth of my breathing, thanks.
If you are finding it easier to nasal breathing near the end, you are likely breathing deeper. Breathing deeper at the same rate is increasing your tidal volume.
More oxygen from the respiration system will take a load off the heart rate, allowing it to come down at the same workload.
What you are experiencing is basically the opposite of what I often discuss in actual decoupling (cardiac drift) – it is the respiration system getting worse – so the heart rate has to compensate at the same workload.
I don’t experience the decoupling during swimming, where breathing is a more conscious decision. I could even say that I can control speed through the breathing rate. In the past I’ve spent a lot of time on optimising breathing during swimming. Throat position, tongue position, timing of exhale. It’s time to transfer that to speed skating.
I’ll get back with some results after the next skating session.
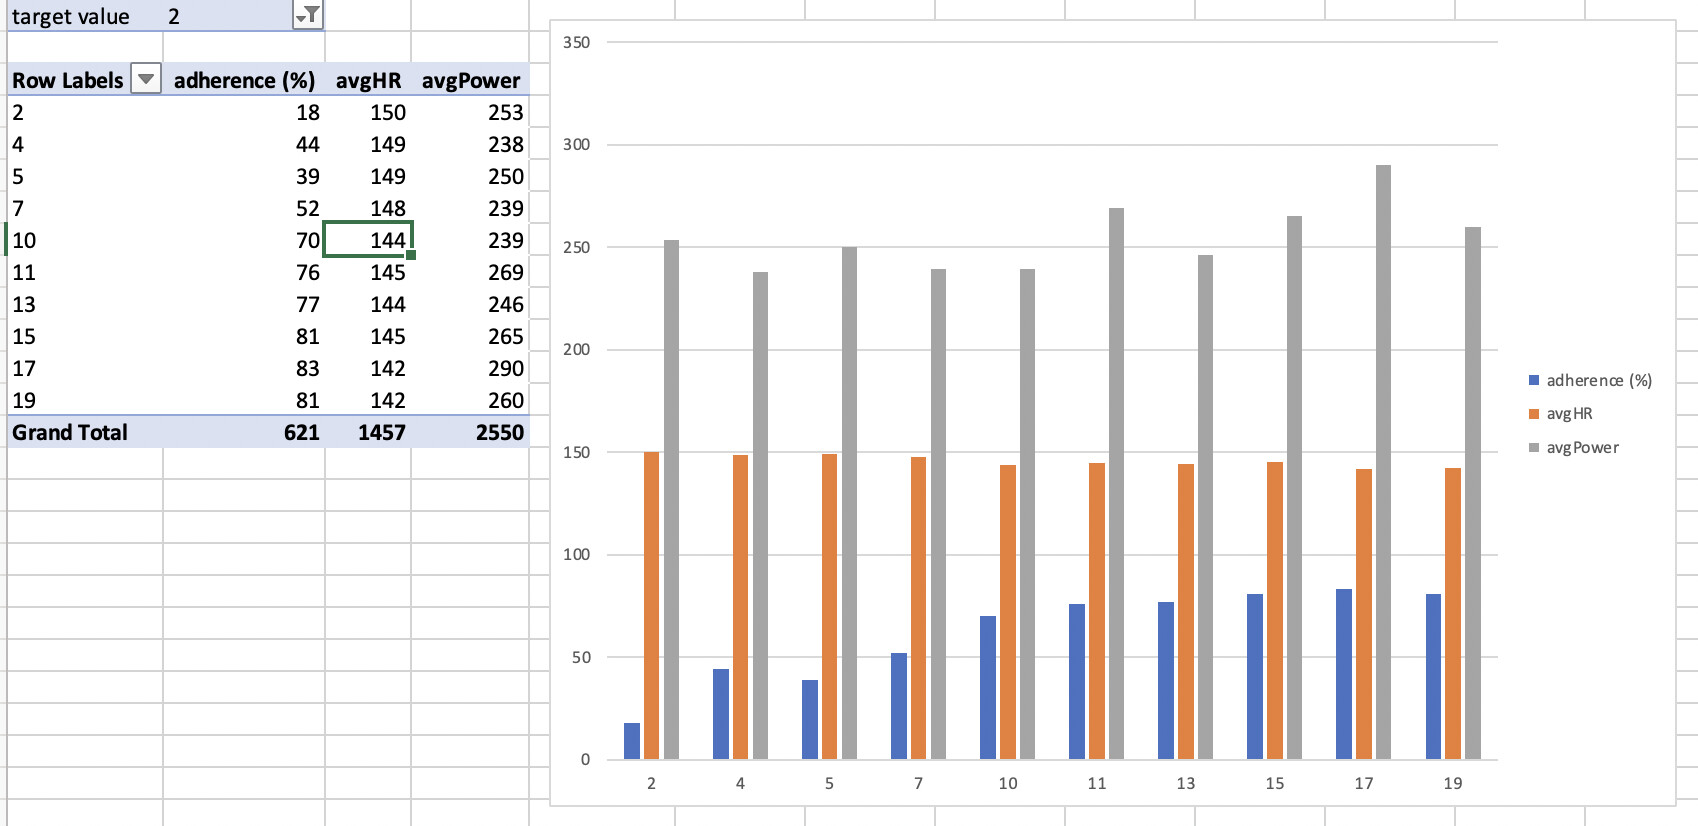
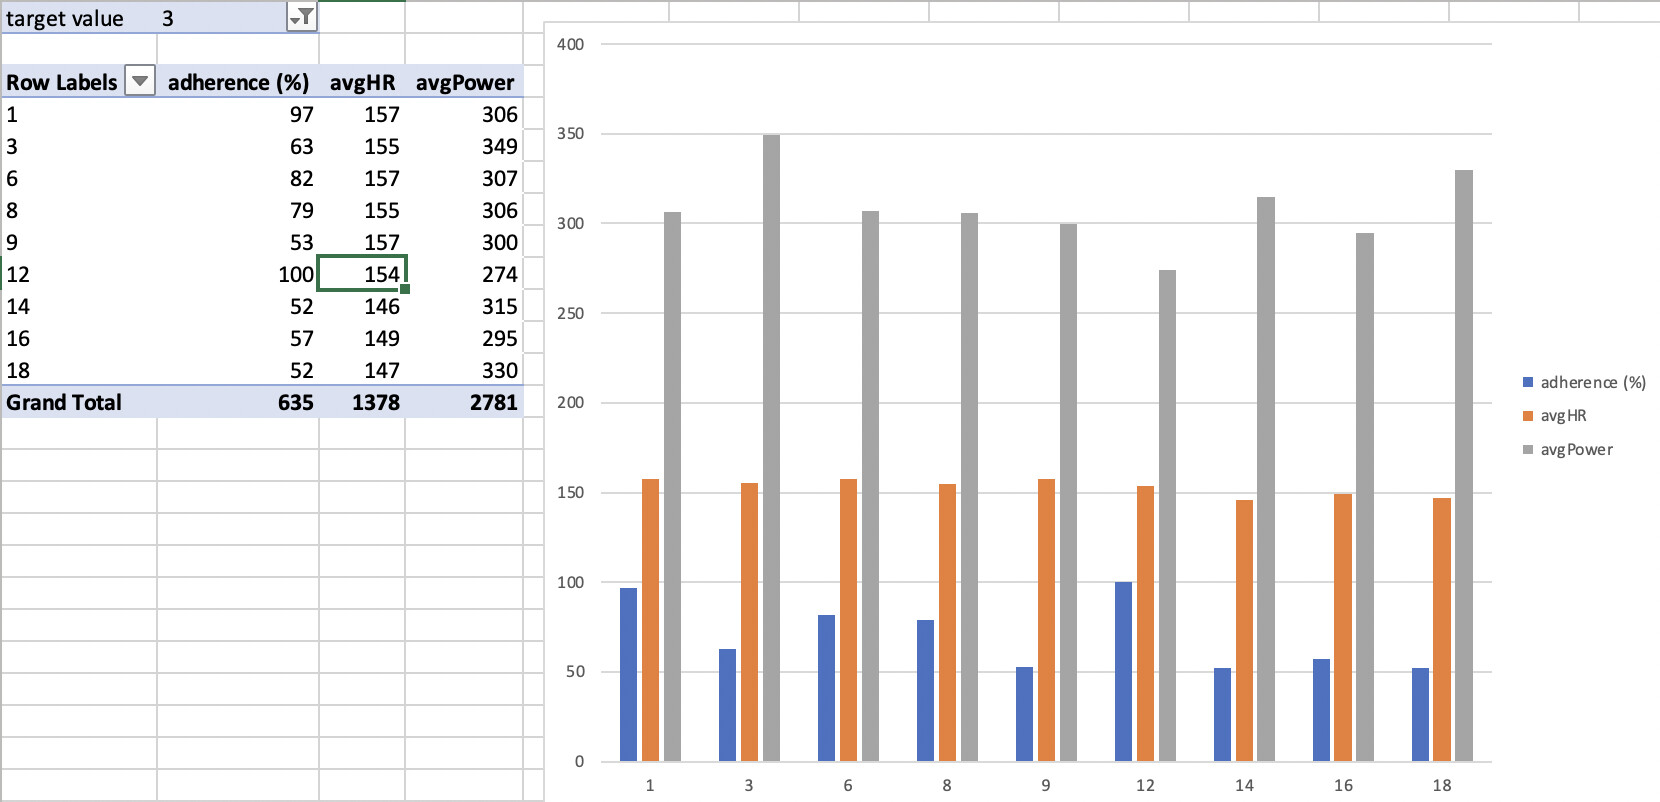
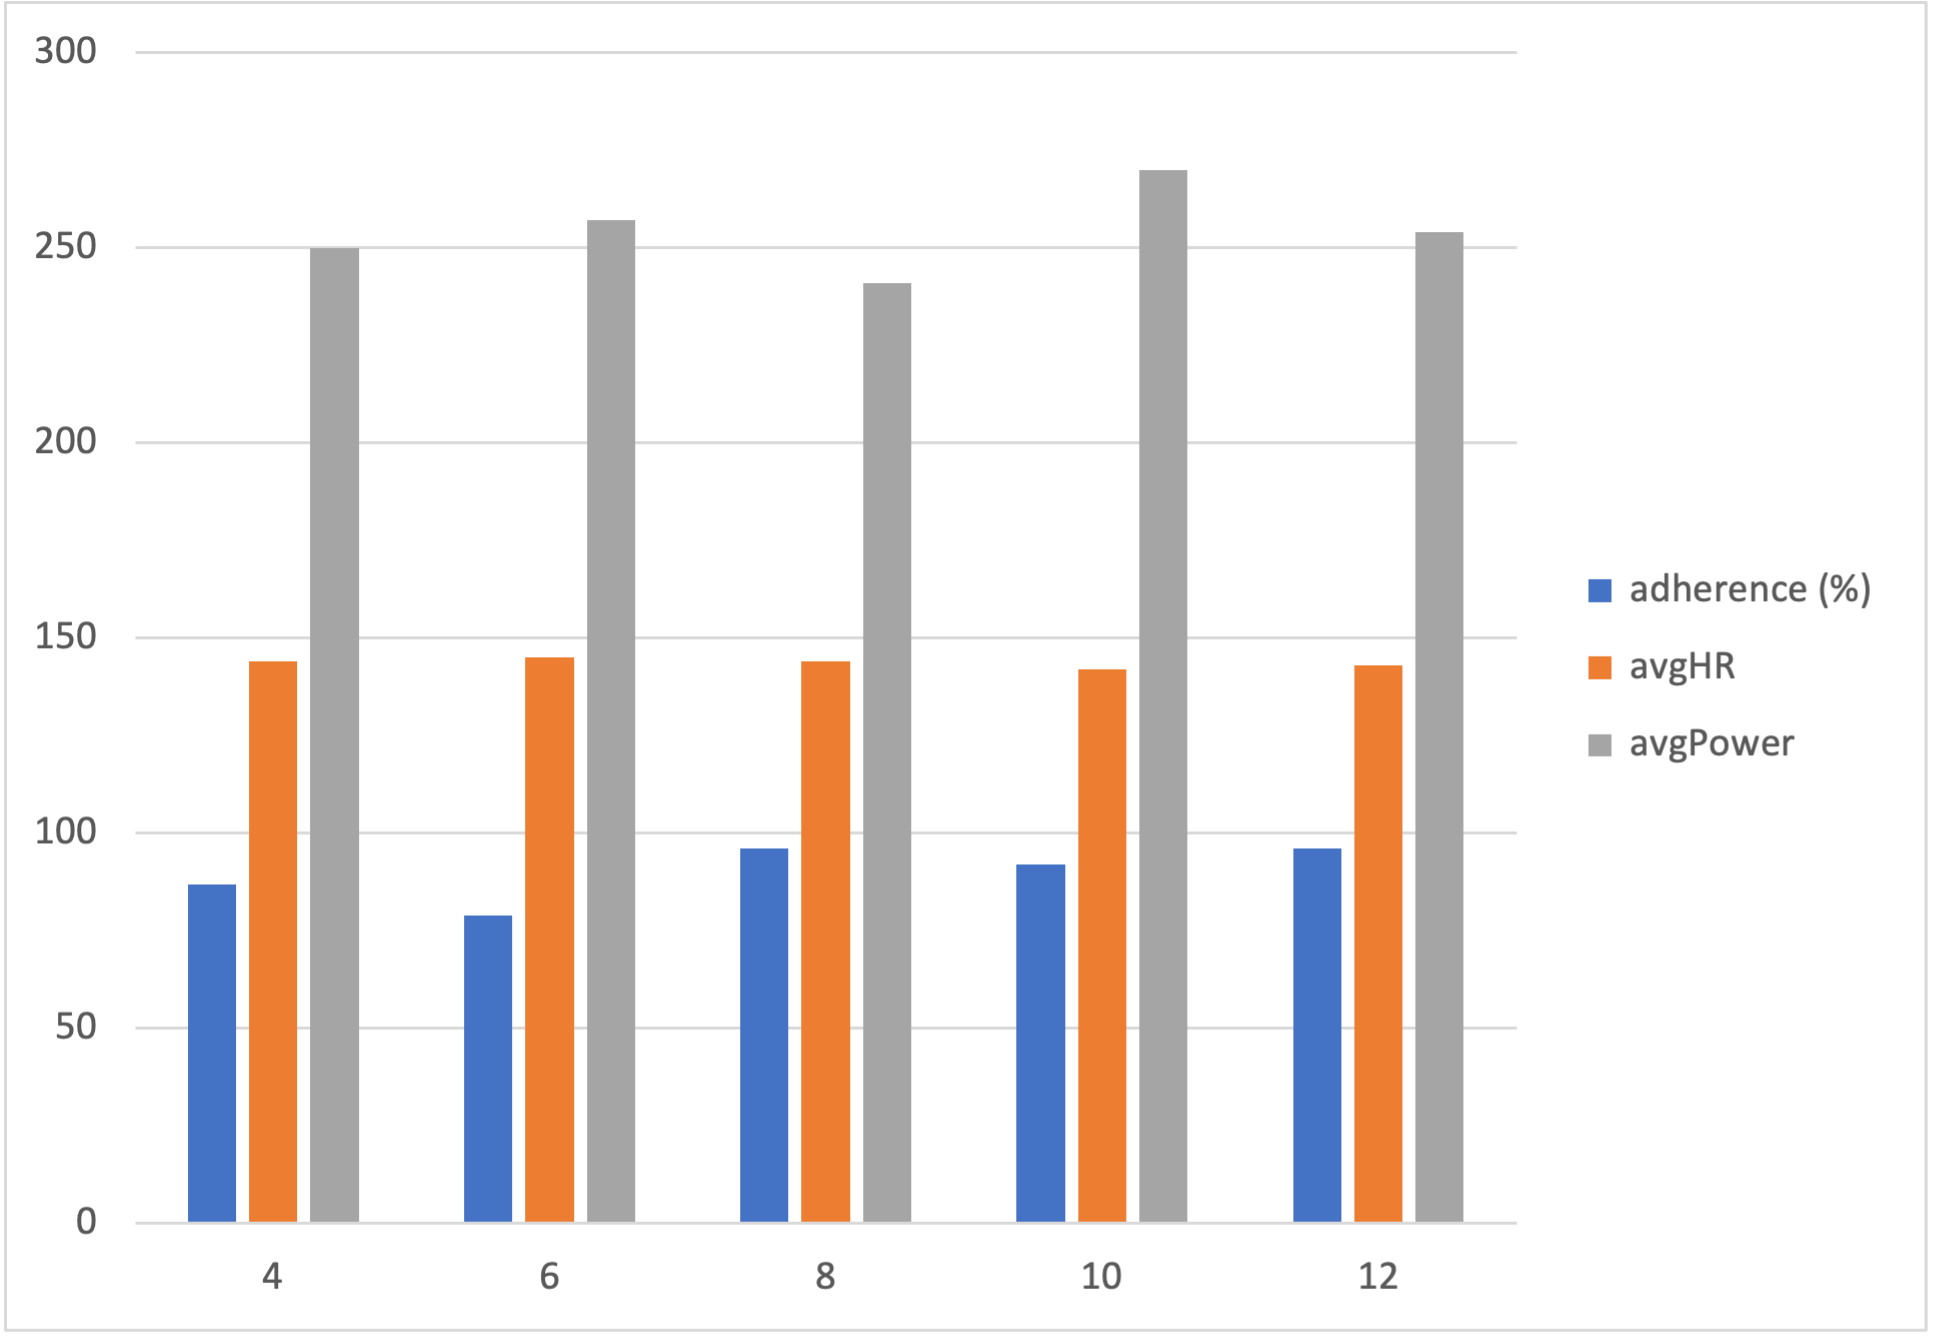
AvgHR and AvgPower don’t need an explanation I suppose
The adherence metric indicates the percentage of time spent in the prescribed zone.
A few remarks:
Zone adherence is quite difficult with skating as each elevation change, corner or dog in the park is of great influence. Performance in zone 2 is usually better than zone 2, as the section duration is much longer.
if performance in one section is way off, it usually is because of a slow corner / dog / other interruption
let’s wait a few more times for the same session you originally did, however, if you see this often and the depth of breathing increases while the rate decreases, this is maintaining or increasing tidal volume. So if TV stays the same then HR will likely stay the same, if TV increases HR will likely drop (causing the negative decoupling.
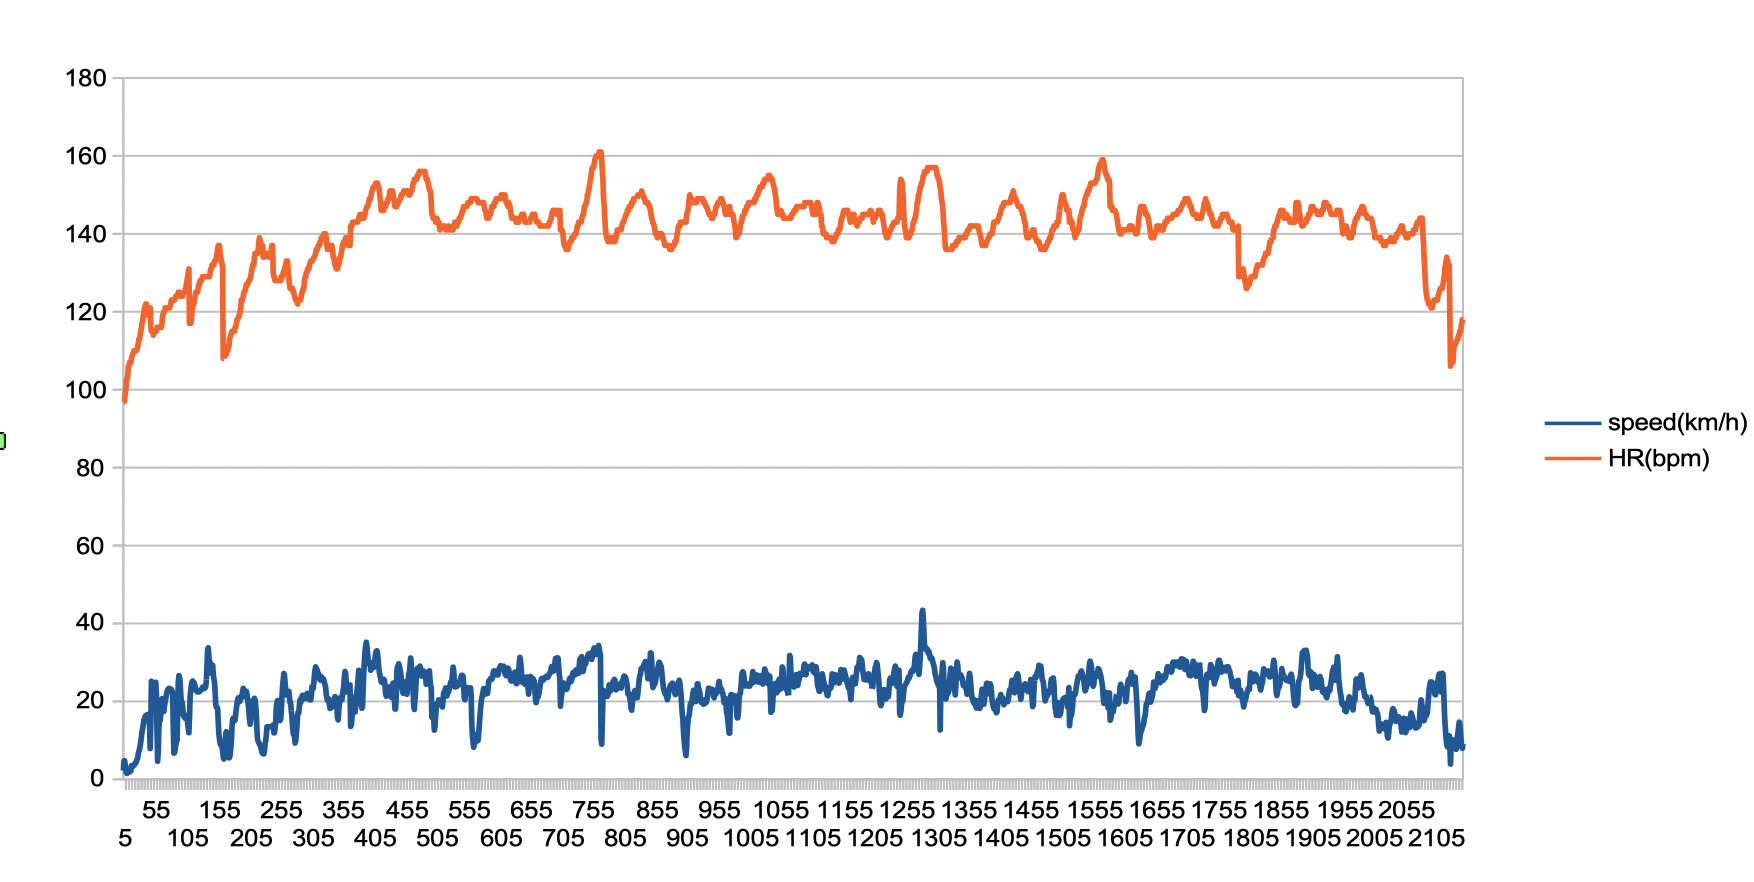
Different session today: 30 KM on 400m indoor ice skating track, with a sprint every 10K.
Same graph, although my pace was significantly slower in the 2nd 10k and 3rd 10k as i was pretty fatigued from this week’s volume.
The first 10k was pretty oke, but in the second 10K i felt very fatigued already because of all the corners. The 3rd was even worse.
Compared to the other data from the outside sessions, the leg muscle fatigued was much more significant in this training because of all the corners.
This made me wonder: could the reduced HR also be the result of fatigued muscles that are delivering less power, and therefor the heart has to work less hard?
The ‘relative small reduction in speed’ might be explained by the fact that there is a lot of gliding involved on the ice (and rolling on the asphalt).
Hmmm. It would be nice to do identical workouts in a skating rink because rolling the mechanical energy will heat up the wheels and (generally) reduces rolling resistance. A potential confounding variable to that method of comparison.
I notice this effect with polyurethane roller ski wheels. What type of wheels do you use?