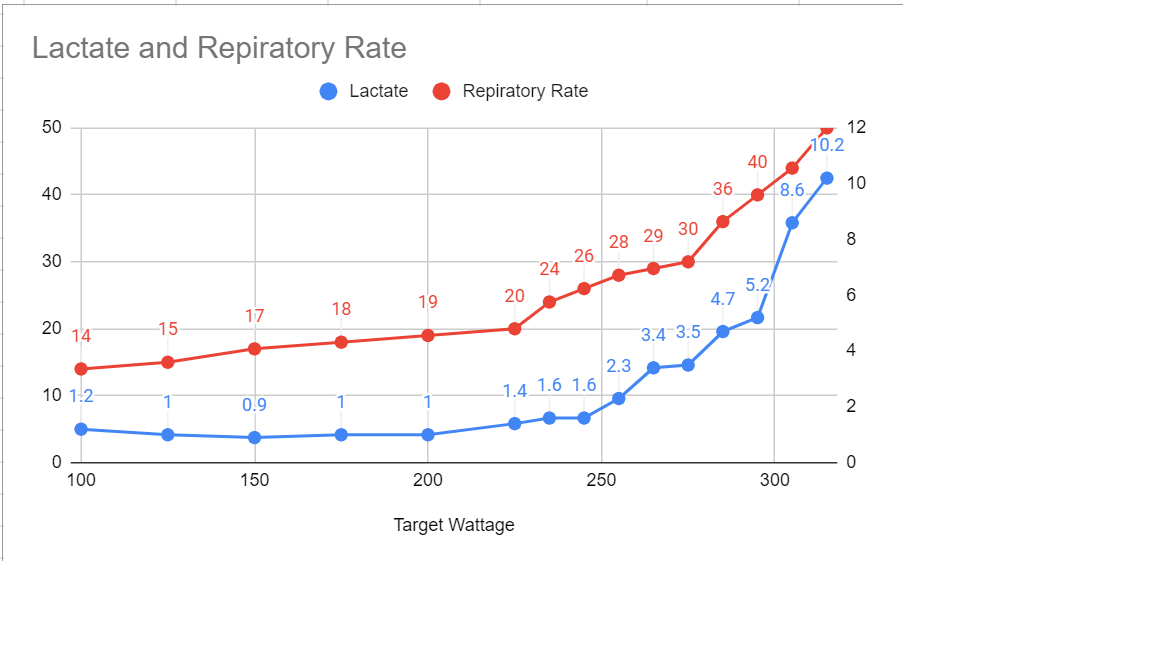
@shawnfife here we go! can you post a lactate / resp overlap graph
If you are planning to train respiration make sure you get a test first, but needs to be a specific protocol, to determine your strengths and weaknesses.
It can be a big waste of time if you don’t know your strength limiters.
With respiratory training - finding strengths vs limiters, would that be using a metabolic cart?
I’m probably a couple of months out before I can get a cart and then looking at getting a P100
I reading Stephen Seiller yesterday about this technology
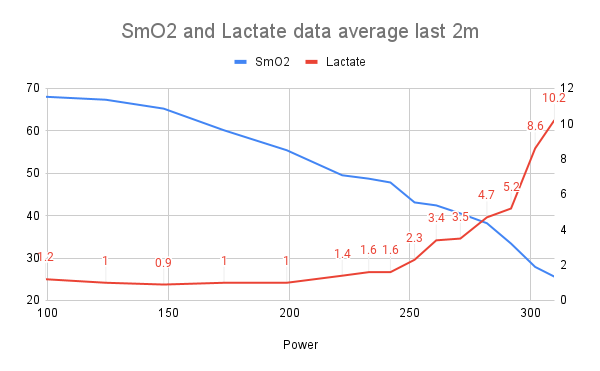
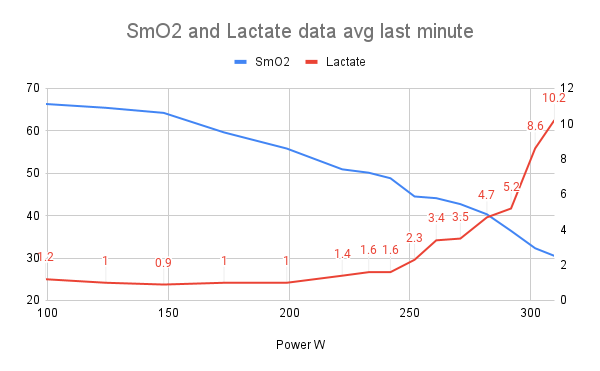
IN this graph i only seen changes in Thb , at 254W , you can pick the inflection point (like lactate) , with Smo2? ( i imagine, yes - but i can seen in this graph)
For VT1 , 19 to 20 , how i suppose to know this is the inflection point?
Depending on how you analyze the data you can understand different changes in the physiology.
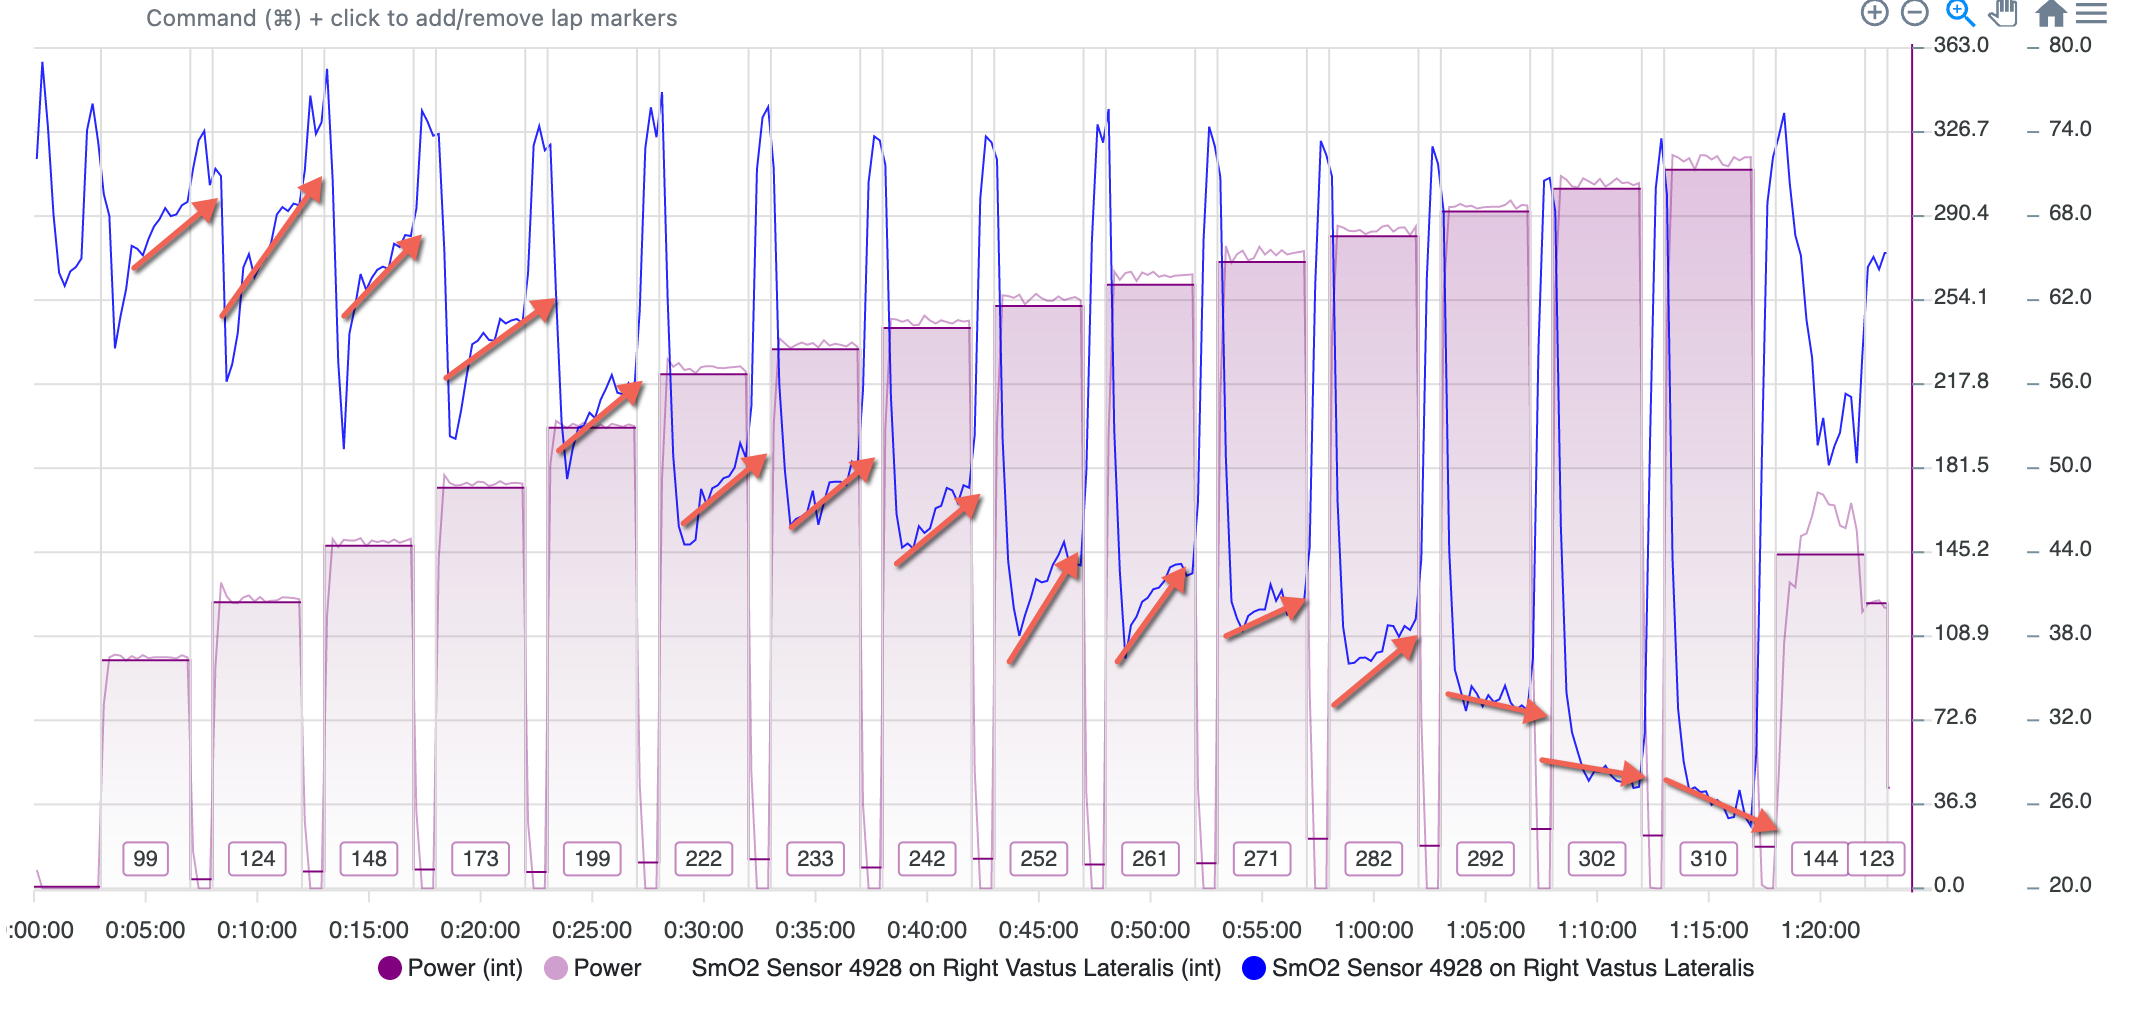
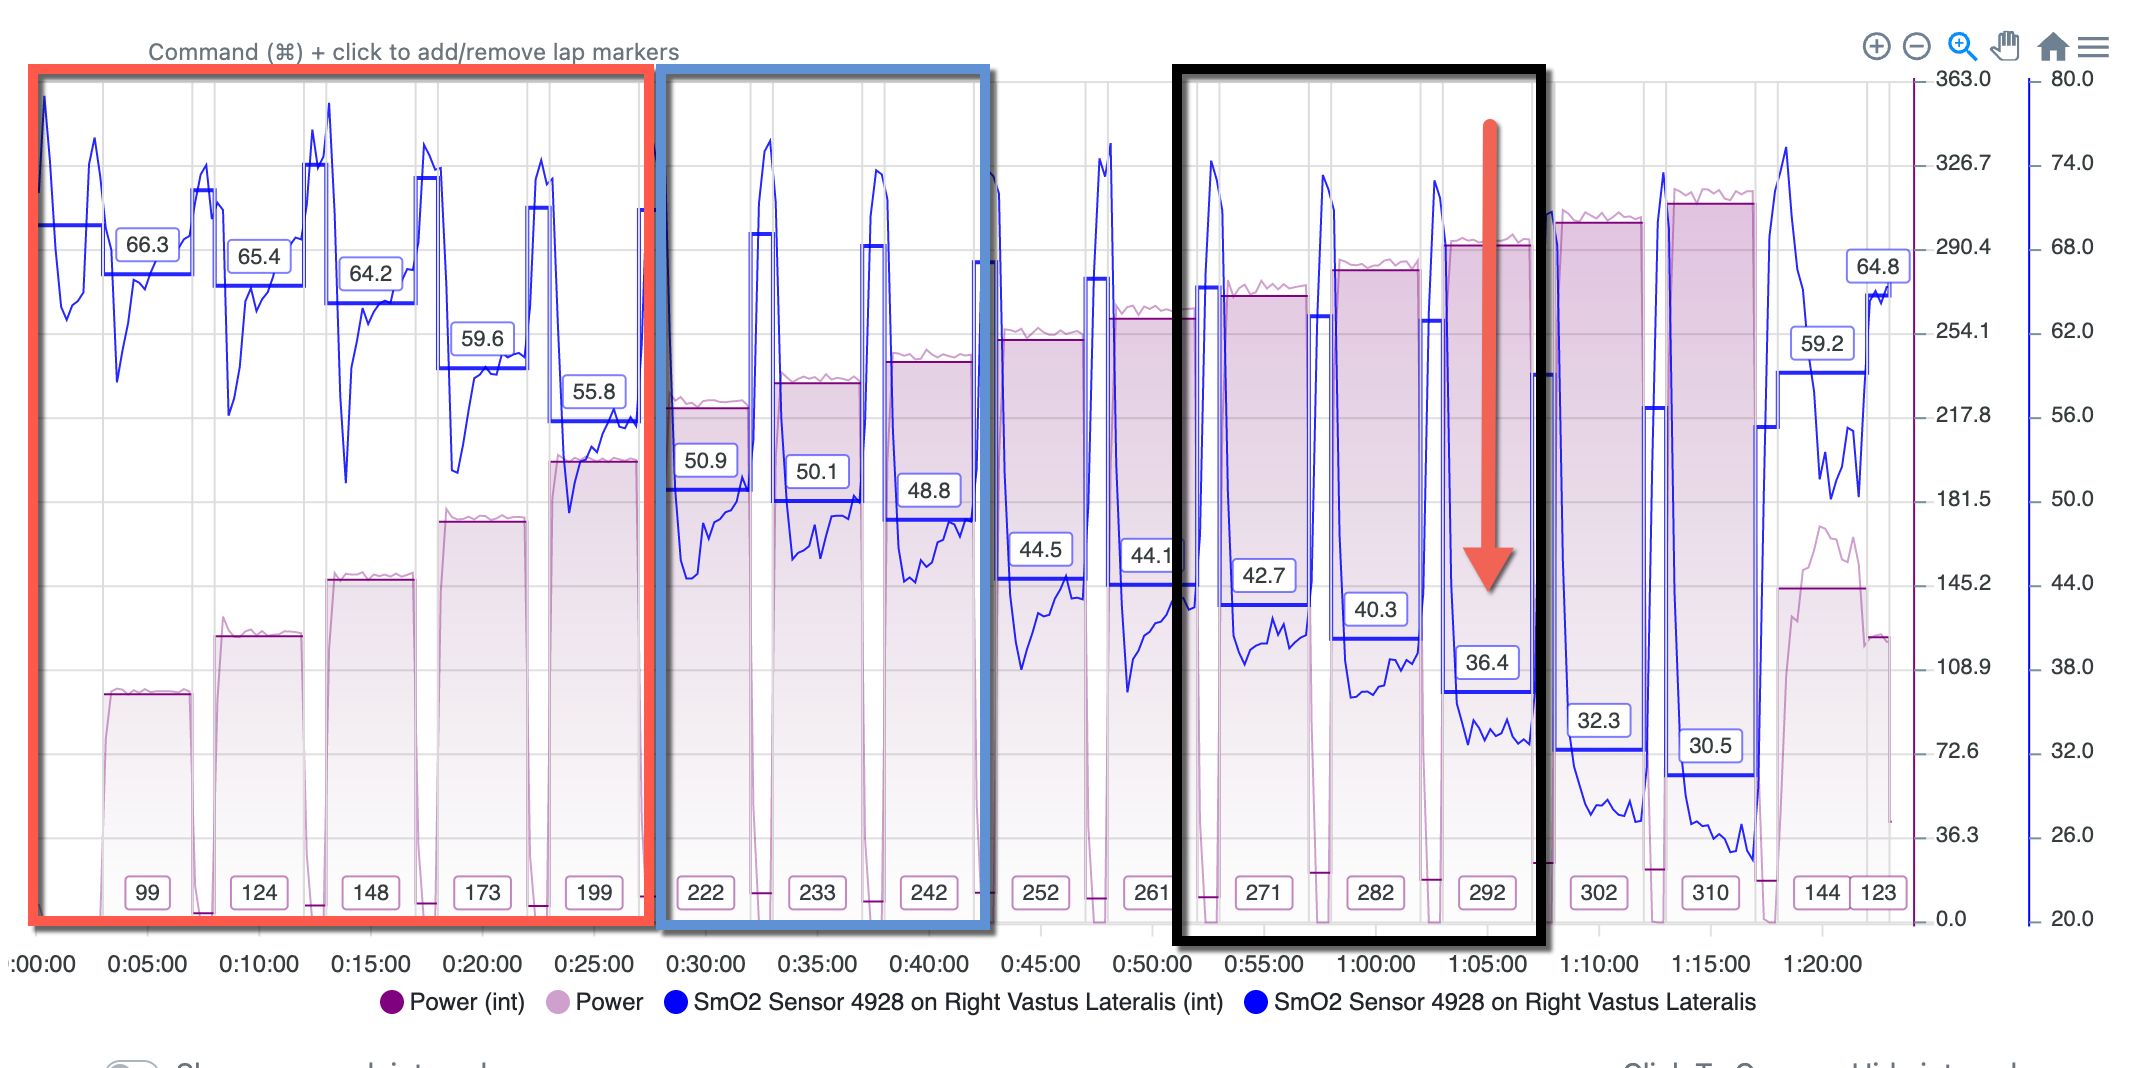
If we look at the slope idea, if the smo2 is rising during the workload there is more availability than utilization.
However, even when looking at this, you can see that during the harder steps, there is a point where it is still rising but the smo2 rises just to the average of the entire interval. ( have an app for this coming to the garmin connect site that will show current smo2 relative to the interval average - handy when doing steady steady work below threshold, like live testing during your workout).
If we bring in pwhr into the mix we see some interesting similarities. I find looking at this data gives a good training zone, where is lactate and smo2 can give us a ceiling for that zone. Either or really but the pwhr does give interesting info, it gives clearer info when the test is done by heart rate (rather than power in this case, but still some clear changes along the step test).
If we look at smo2 - the step where the red arrow is where availability and utilization are equal, the only thing here is HOW LONG could the athlete hold this during a workout, but this is likely a ceiling for threshold, and that just below this with smo2 in low 40s would be the best spot to train threshold.
@afitz Just make sure the training isn’t ever stressful.
It is important to be very consistent and grow slowly.
Most programs will have some breath-holding in them so if you have never done any of that I would recommend following the training they suggest every day, but I wouls also add the Square workout and slowly work up until you can breathe in for 5 seconds, hold for 5 seconds, breathe out for 5 seconds hold for 5 seconds.
Enjoy you will likely notice some differences inside the first month.
Don’t forget to always plug your nose when you do this training and testing on this device.
I just signed up on the forum, so am a bit late to this discussion, but thought I might be able to add some info. I’m a cofounder at Tyme Wear, just so that’s out of the way
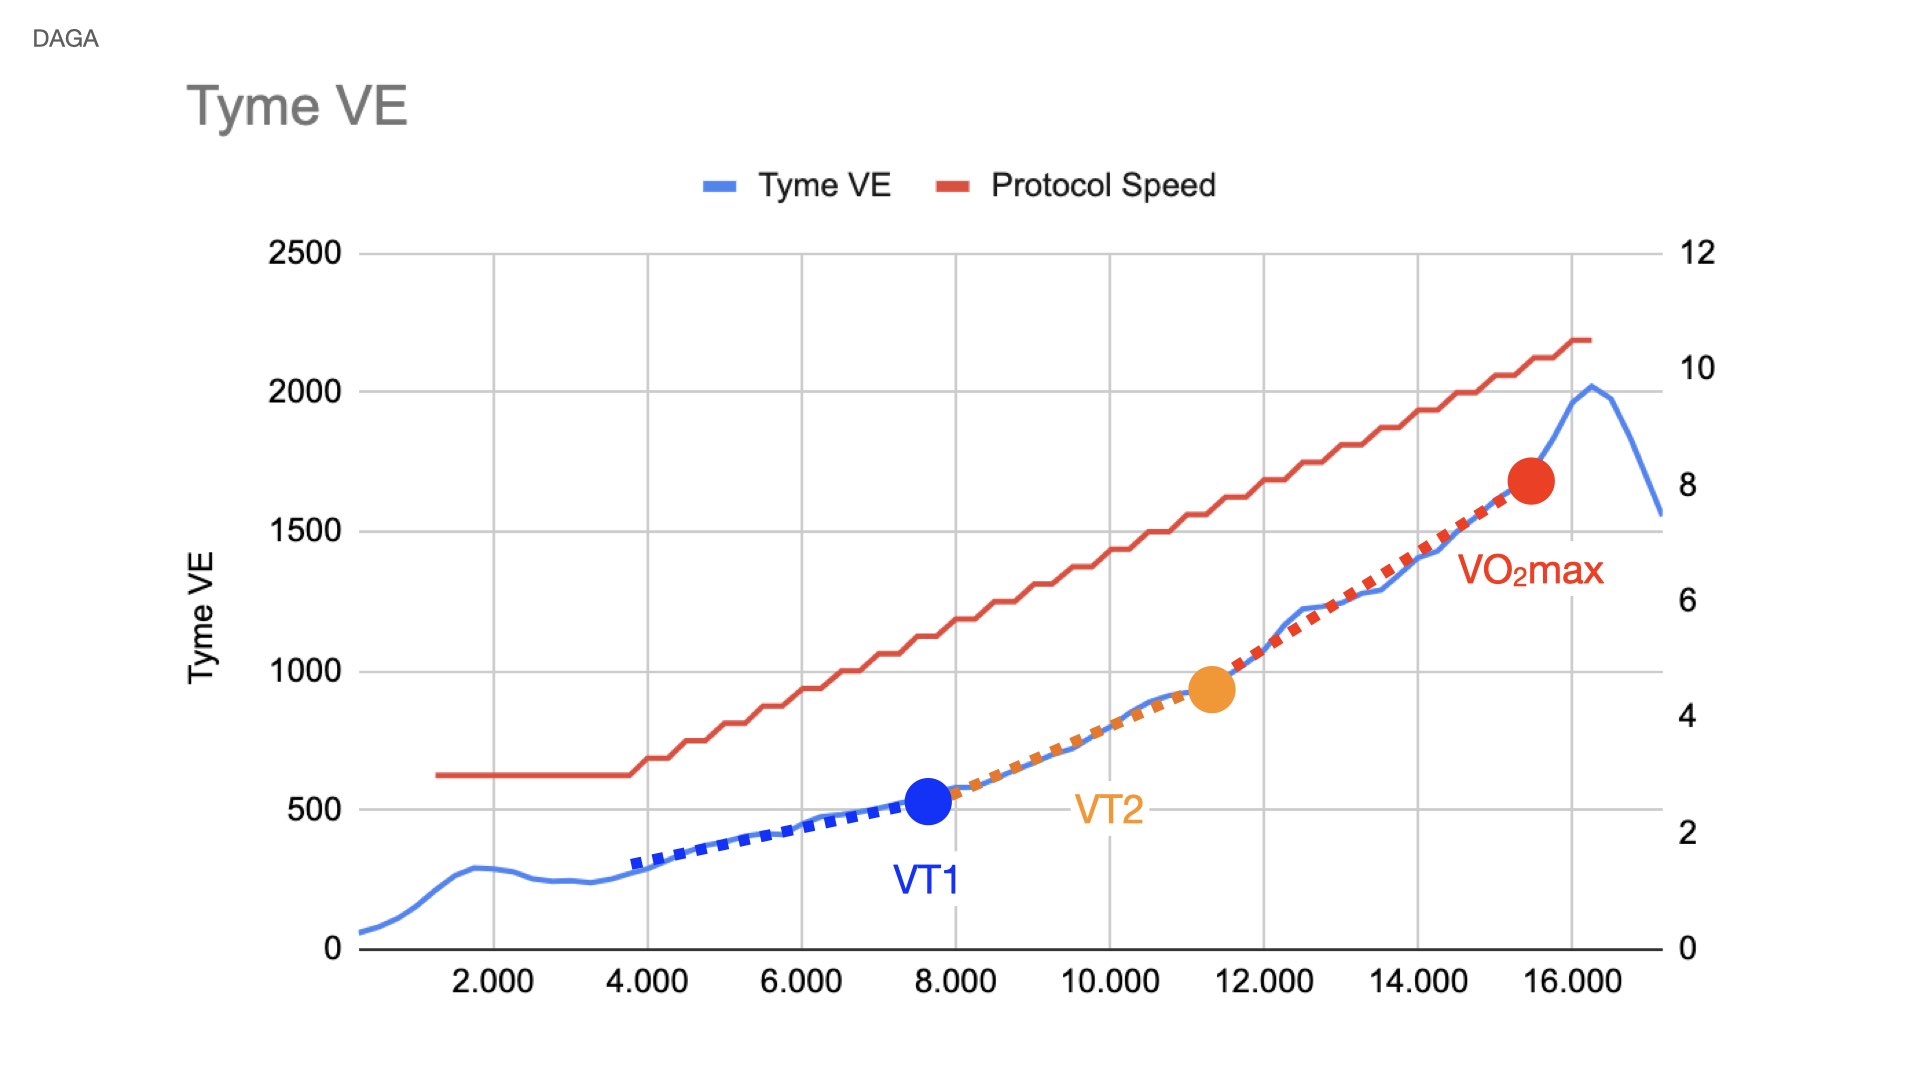
@shawnfife We’ve found that to assess ventilation thresholds from breathing alone it is really helpful to use minute ventilation - breathing rate x tidal volume. Like @steveneal mentioned athletes can train their breathing muscles, and there is generally a wide range of individual breathing patterns. In most cases, by looking at the net airflow, we get around these trained or individual patterns.
Here’s an example data set that is part of a study that will be published early next year comparing Tyme Wear vs Metabolic Cart during a treadmill ramp test. The data below are from the same subject collected from the Tyme Wear smart shirt. Tyme Wear VE is in independent units since the Tidal Volume that is used is a digital value from our sensors, not calibrated to Liters. We also apply some behind-the-scenes cleaning up on the VE signal.
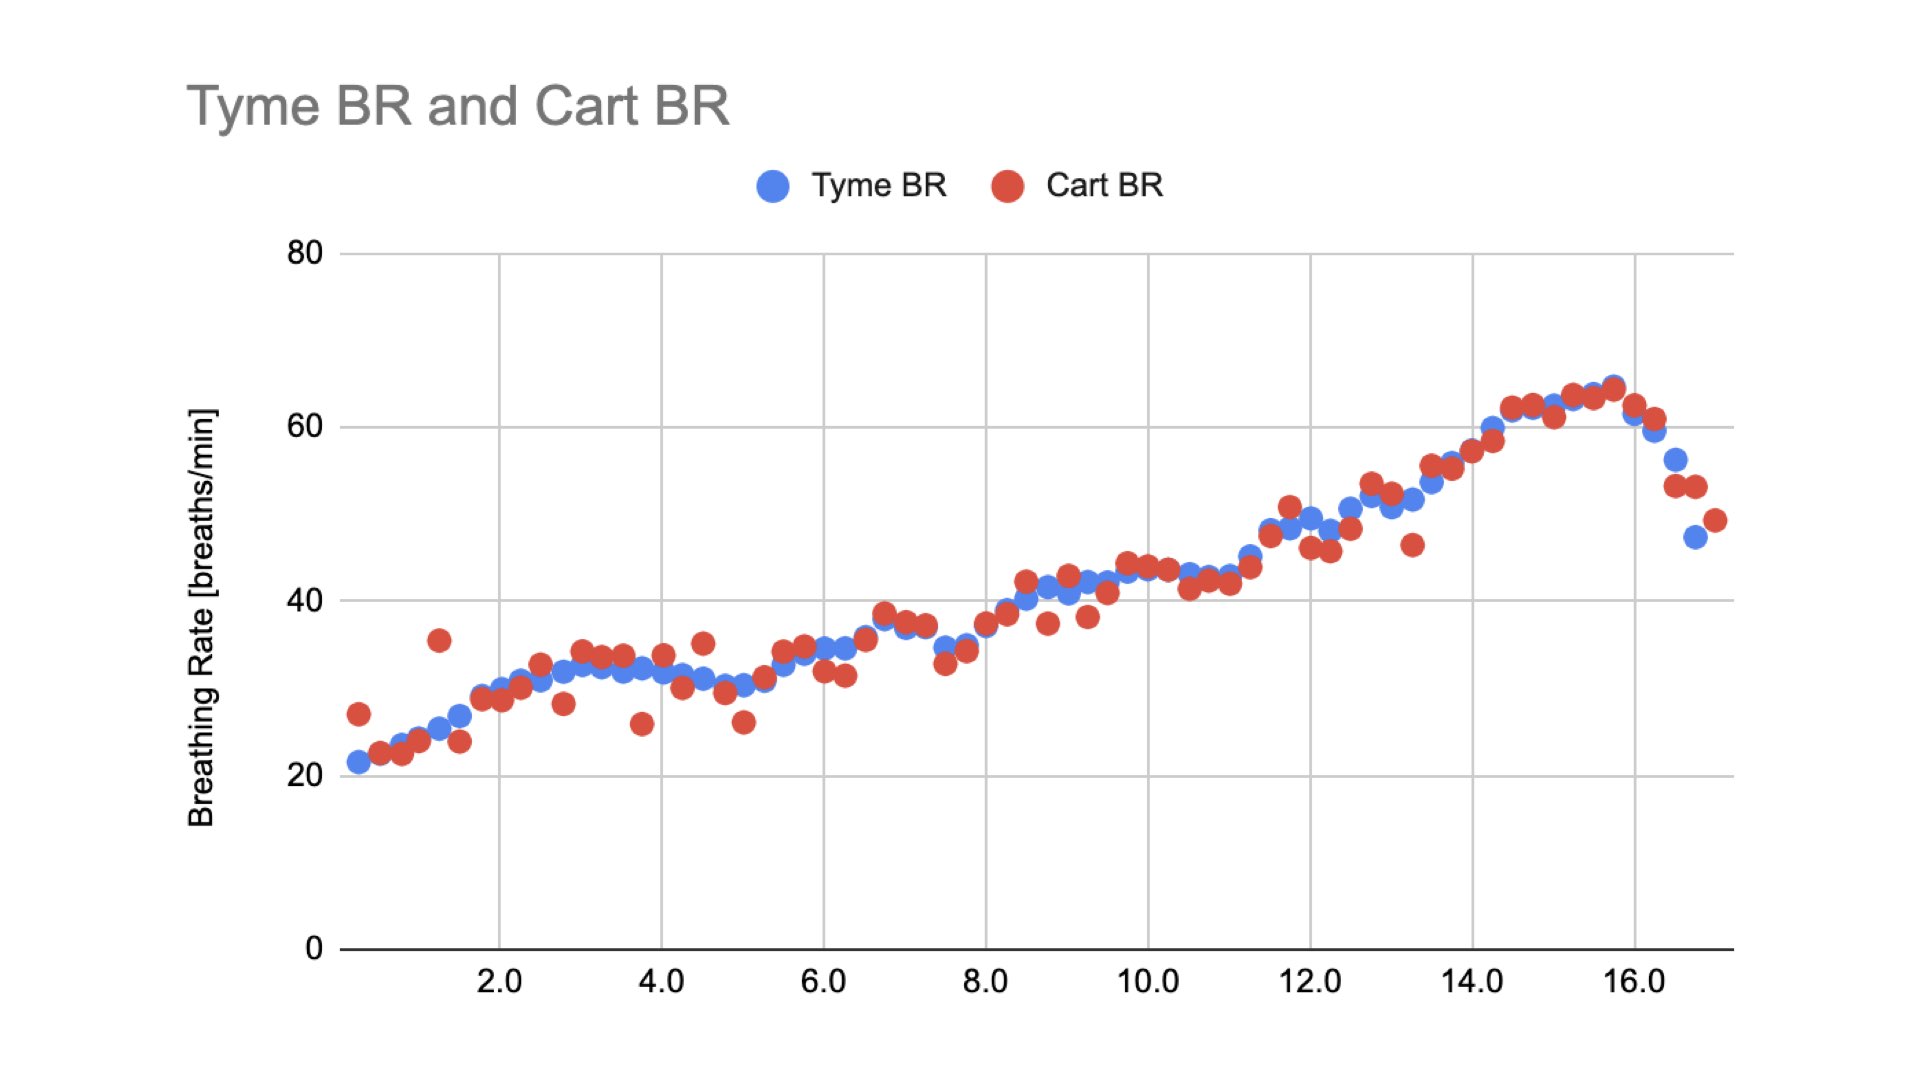
For those interested, here are the raw breath-by-breath VE, BR and Tidal Volume signals from the Tyme Wear smart shirt compared to the Metabolic Cart VE, BR and Tidal Volume from the same subject as above. On about 50 subjects with over 100 records, our accuracy compared to a metabolic cart currently stands at about 97% for breathing rate detection, 85% correlation with cart tidal volume, and 94% correlation with cart minute ventilation.