Has anybody come across this wearable? A general question as well: how would training to Ventilatory thresholds compare to training with ones from lactate measurements or from traditional ftp tests.
nope, but sounds cool
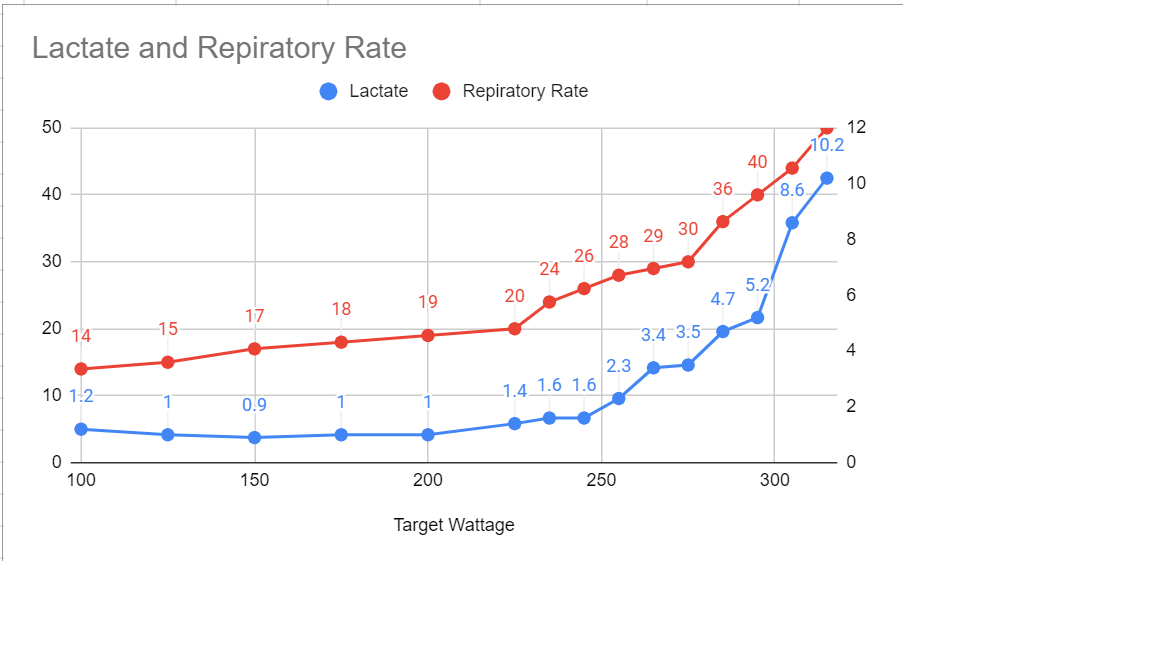
Here is a step test I performed, 4 min steps, collected respiration rate the last 30 seconds of each step.
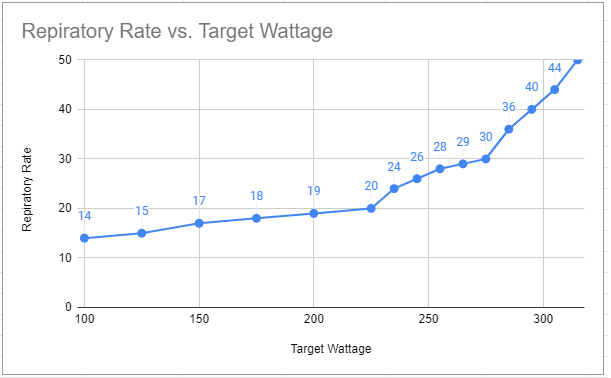
What is happening at 20 breathes/min?
What is happening at 30 breathes/min?
We can answer those questions by understanding what drives ventilation.
1 Like
@carytb You can use the VT and I would say it is equal or maybe even better than lactate, AS LONG AS THE ATHLETE HAS NOT TRAINED THEIR RESPIRATION SYSTEM. IF THIS IS THE CASE ONE CAN MANIPULATE RESPIRATION, PRE-HYPERVENTILATION OR OTHER METHODS WHICH COULD THROW OFF THE CURVE THAT @shawnfife has posted.
Most people will not be able to do this so the ventilation system would be a great way to track what you are looking for…as long as the shirt actually works unlike other respiration devices that don’t.
@shawnfife did you take lactate or wear your moxy during this test? If so why not post all to see how they compare.
As Steve has suggested, I have not trained my respiratory system.
Looking forward to doing so and seeing how things change.
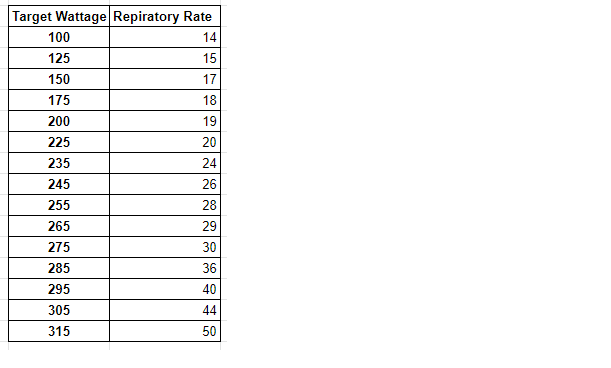
Here is the data for the first chart
Only have access to Intervals.icu from my work CPU
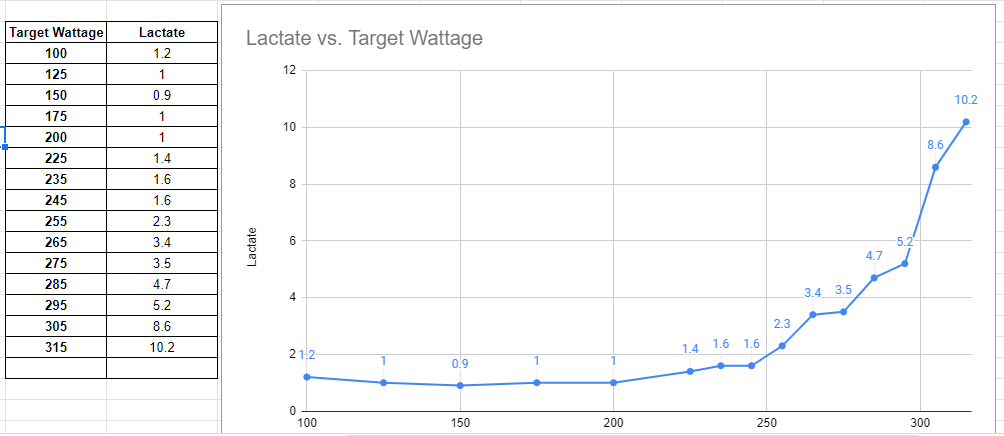
@shawnfife here we go! can you post a lactate / resp overlap graph 
If you are planning to train respiration make sure you get a test first, but needs to be a specific protocol, to determine your strengths and weaknesses.
It can be a big waste of time if you don’t know your strength limiters.
Steve
3 Likes
I like it
The VT is just before the lactate just slightly.
An likely the best range is VT to LT…
Thanks for posting I can no longer be the guinea pig I was for 25 years…plus my stuff is still in the van all packed up from the move.
At least we are on the same time zone now.
So I would use lactate as a ceiling…and vt as a beginning of a zone…
I am always up for being a guinea pig!
With respiratory training - finding strengths vs limiters, would that be using a metabolic cart?
I’m probably a couple of months out before I can get a cart and then looking at getting a P100
There is a way to test using the P100 but I prefer to use a met cart, and then train on airofit or p100 or both depending on where the client is.
Before you buy a cart…make sure you reach out to me so you get one that is valid…or it isn’t worth it at all.
Hi Shawin Thank for share.
I reading Stephen Seiller yesterday about this technology
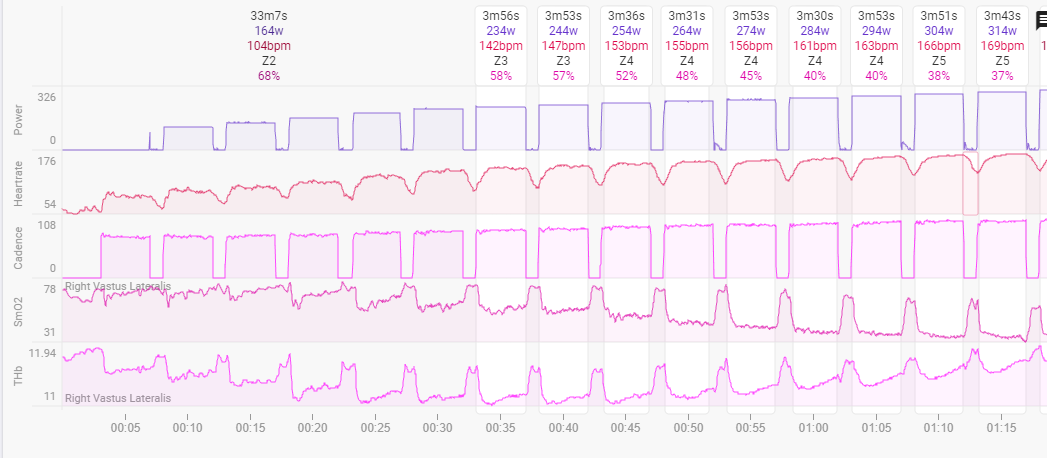
IN this graph i only seen changes in Thb , at 254W , you can pick the inflection point (like lactate) , with Smo2? ( i imagine, yes - but i can seen in this graph)
For VT1 , 19 to 20 , how i suppose to know this is the inflection point?
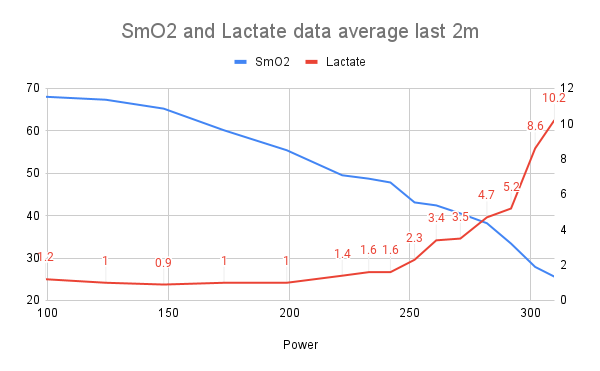
Just to display the data in a few different ways. This is taking this post a little sideways so I apologize. Just some different ways to look at data.
If we average the smo2 data for the final two minutes of each interval.
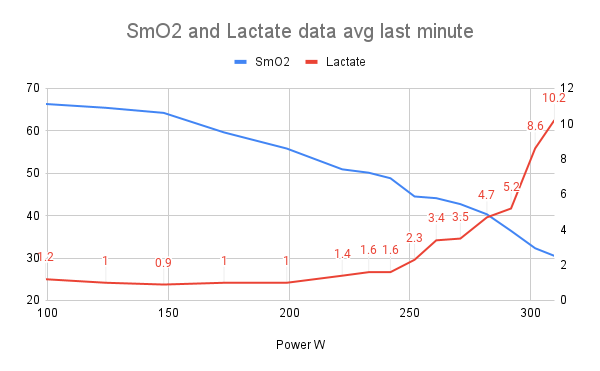
If we average the smo2 data for the final minute of each interval.
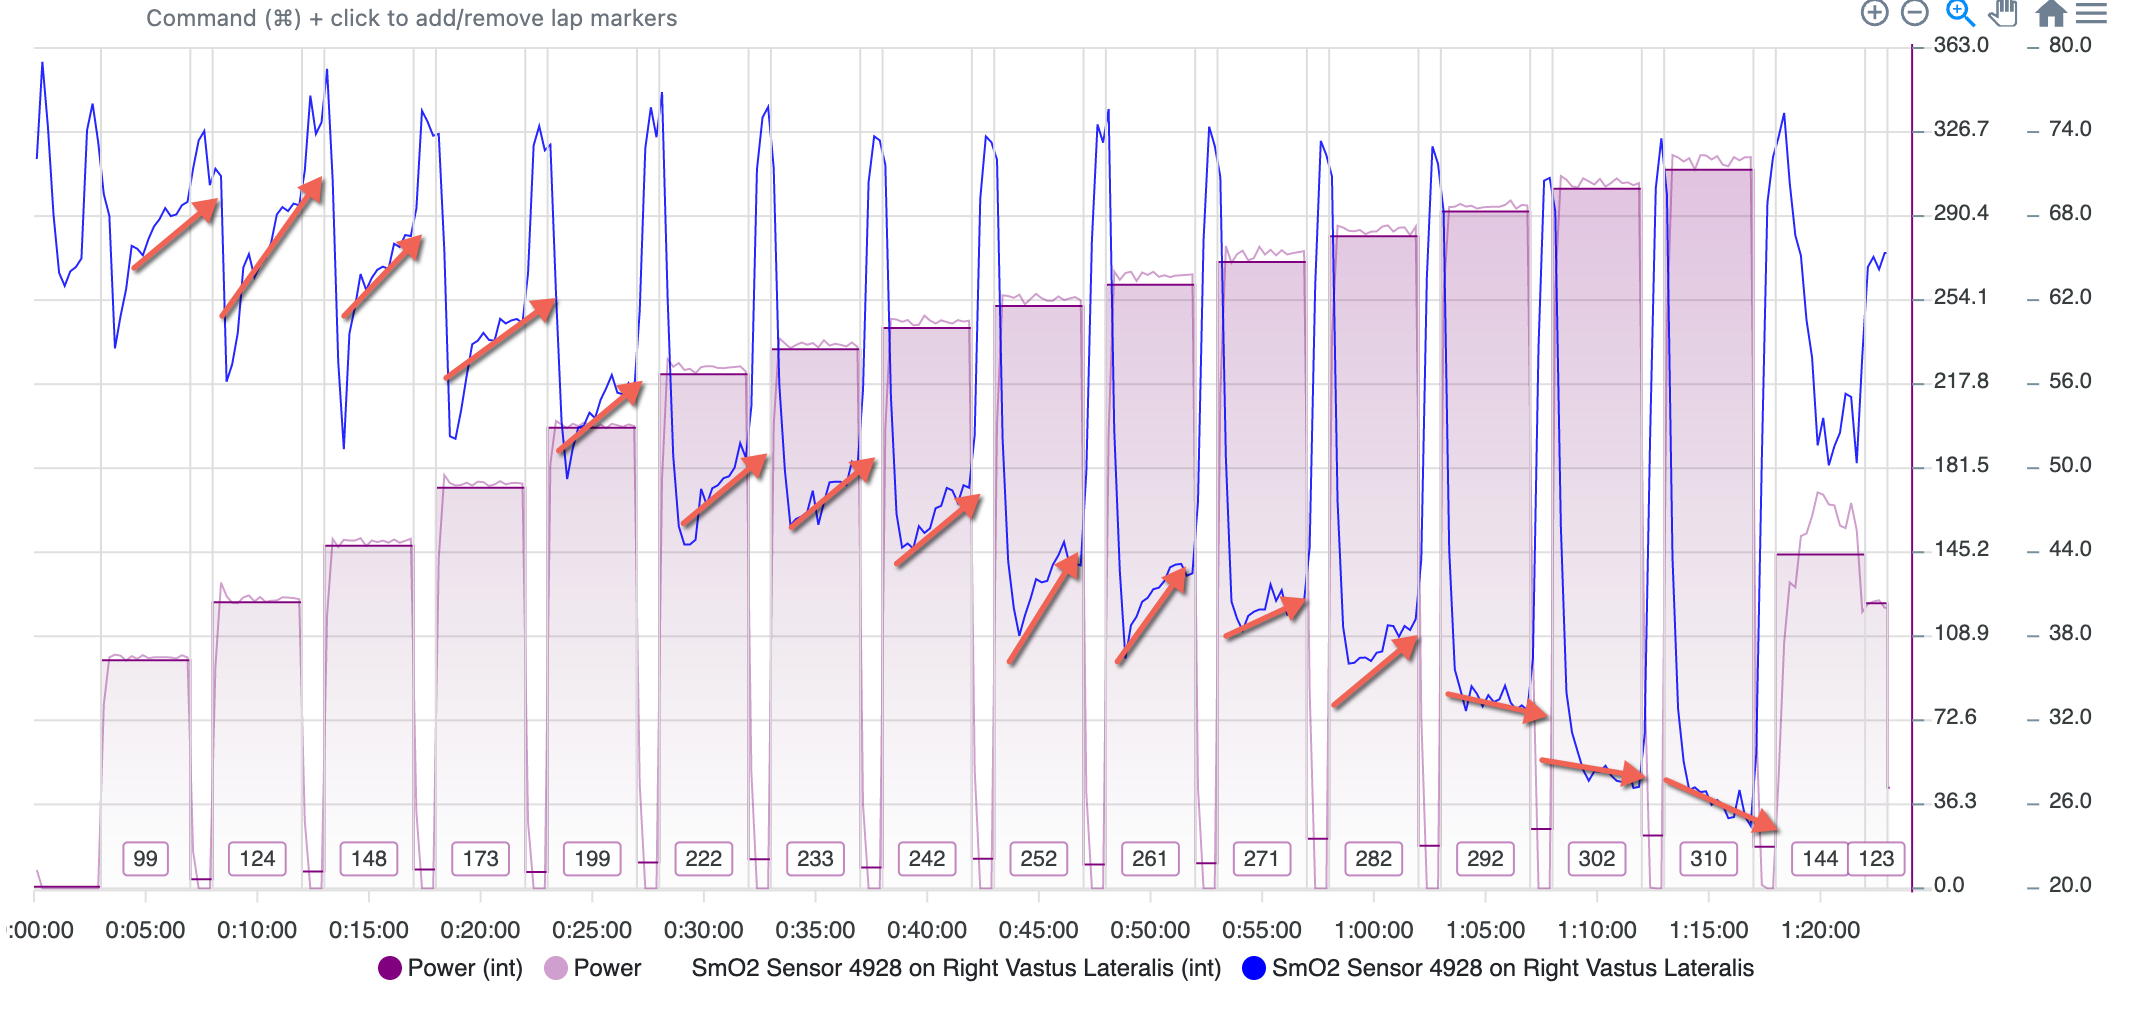
If we look at the slopes of the smo2 during each stage.
Depending on how you analyze the data you can understand different changes in the physiology.
If we look at the slope idea, if the smo2 is rising during the workload there is more availability than utilization.
However, even when looking at this, you can see that during the harder steps, there is a point where it is still rising but the smo2 rises just to the average of the entire interval. ( have an app for this coming to the garmin connect site that will show current smo2 relative to the interval average - handy when doing steady steady work below threshold, like live testing during your workout).
If we bring in pwhr into the mix we see some interesting similarities. I find looking at this data gives a good training zone, where is lactate and smo2 can give us a ceiling for that zone. Either or really but the pwhr does give interesting info, it gives clearer info when the test is done by heart rate (rather than power in this case, but still some clear changes along the step test).

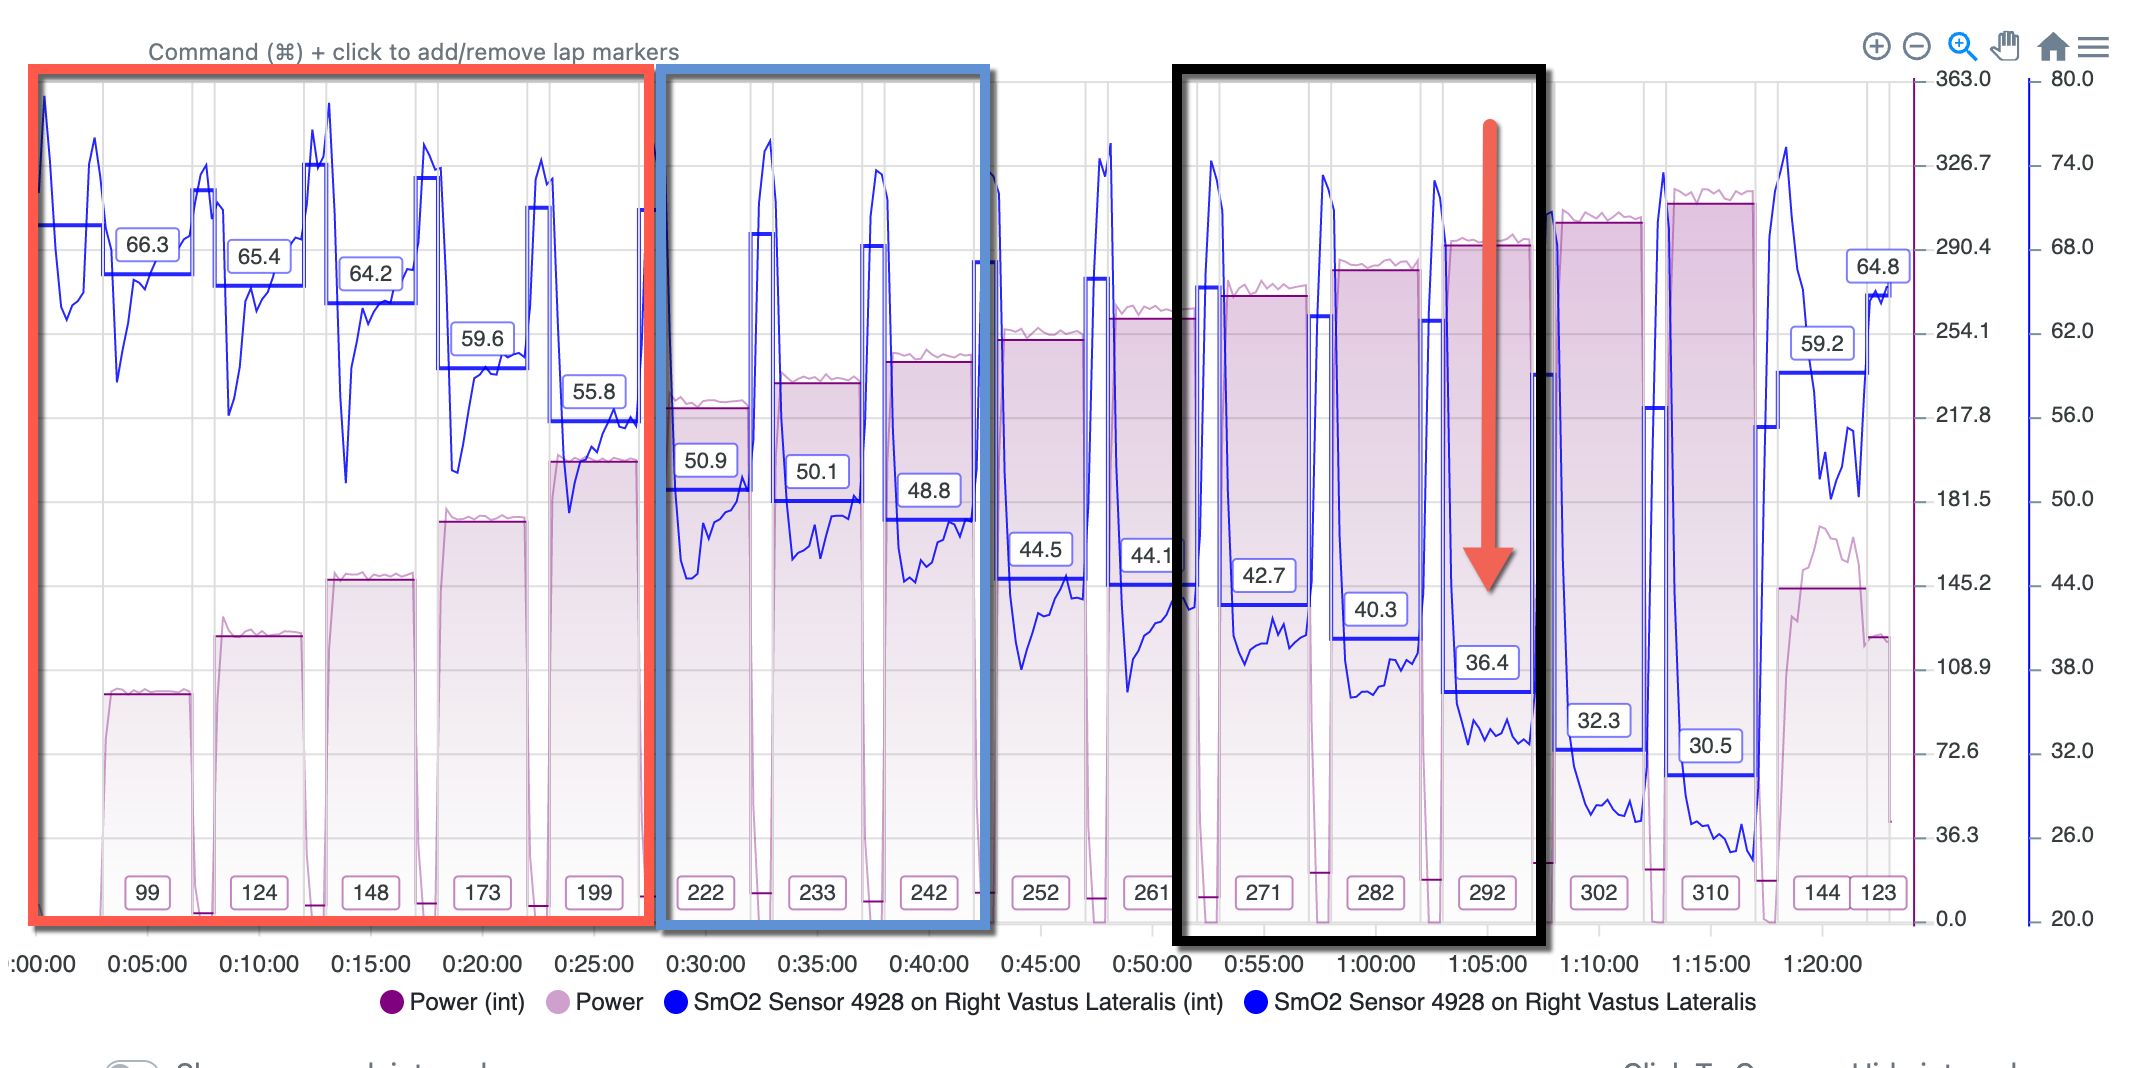
If we look at smo2 - the step where the red arrow is where availability and utilization are equal, the only thing here is HOW LONG could the athlete hold this during a workout, but this is likely a ceiling for threshold, and that just below this with smo2 in low 40s would be the best spot to train threshold.
1 Like
Don’t apologise, it’s really interesting
1 Like
I agree, it’s informative; no need to apologize. 
1 Like
I recommend the saxophone 
I primarily use the Idiag P100 as it does everything you would ever need in respiration training.
The airofit I have used myself and with clients as a starting device prior to P100.
I think the airofit is an excellent tool and take most to 70-75% of their capacity, after that you would need the P100.
Now, getting to the end of Airofit use might take you a year depending on your respiration limiters.
1 Like
Thanks for your respons… i just got my airofit yesterday and try to start a consistent training for now 