I performed a ramp test. Increasing 10 watts every 1 minute.
I had a Moxy on my R Anterior Deltoid (Forgot to relabel the device, as seen on graph)
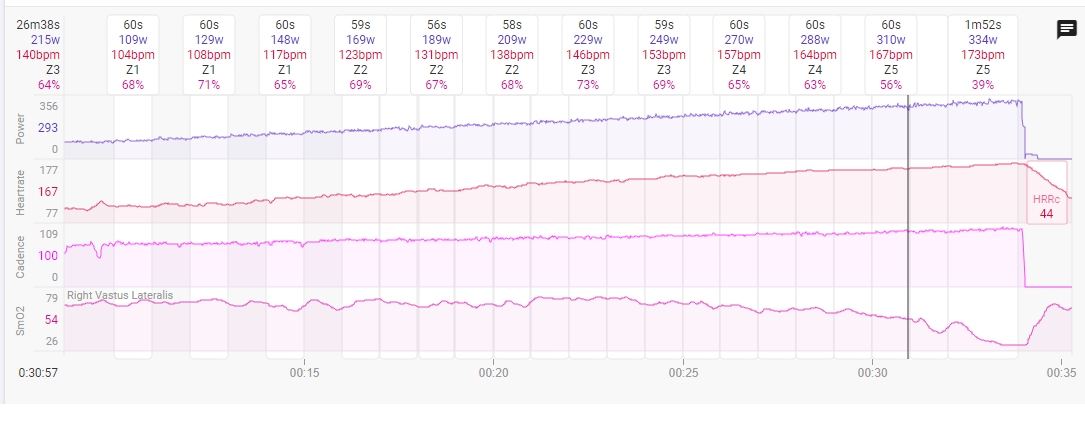
What can we learn from this?
I see after 240 watts the SMO2 starts it’s downward trajectory.
At 340 watts SMO2 flatlines at 31%, that’s all I had in the tank this morning, and the SMO2 seems to agree.
1 Like
Not exactly related to the ramp test protocol you did however you might find this interesting in looking at predicting TTE using SMO2. Similar to what your doing with having the SMO2 sensor on a non working muscle, in this case the lumbar erector spinae. Lots of good info and thoughts but needs more exploration for sure.
3 Likes
below response was before reading the article shared by @THowe
Maybe we can learn from this that your R Anterior deltoid was not at rest → you started pulling on the steering wheel at 240W.
If not, is is research worthy why saturation goes down in non-working muscles. Would our body be smart enough to reroute the oxygen rich blood to the working muscles? To my knowledge there is no such thing as ‘a blood sorter organ’. Would be cool though 
@shawnfife Have you ever done a 60m all-out ftp test? I wonder whether your true FTP is 240 instead of 75% of 356.
@THowe Very interesting!
Perhaps this also explains why my back often gives up during skating before my legs do in moderate efforts.
1 Like
I did a longer format step test about a month ago. the results are posted on this thread. (I was likely more fatigued at the time of the most current test).
Data Points from old test
LT1 200
LBP 240s
LT2 280-290
Thanks for posting that article @THowe,
Yes, that is certainly part of the consistent deoxygenation we see at higher intensities. Directing more force down through the pedals requires greater stabilization throughout the body to counterbalance the torque/leverage. Think of our legs as dynamically moving pistons which require a stable base of support to push off, ie. our pelvis. The asymmetric lateral forces then must then be stabilized by anti-rotation, anti-side-flexion of the pelvis, especially by the lower back postural stabilizers (hence, my interest in the paraspinals/erector spinae oxygenation profile) and ultimately counter balanced by the upper body & arms, stabilizing themselves on the handlebars.
So all that to say, yes, the non-locomotor muscles of the upper body will be recruited and require more energy production from OXPHOS as the force output of the legs increases.
In fact, our bodies are incredibly smart at doing exactly this! Not via a single organ, but with a complex interaction between local and systemic metabolic, hormonal, central command (neural anticipatory response) and peripheral neural reflexes. I won’t get into it here, but I’ll include some good reviews below.
Basically, cardiac output, blood flow, and O2 delivery are redirected toward the most metabolically active and critical tissues (working muscles, cardiorespiratory, brain) via a balance between local vasodilation and systemic vasoconstriction: vascular supply to non-critical tissues is increasingly constricted with exercise intensity (to a point), and vascular supply to critical tissues is increasingly dilated (again, to a point). This provides a natural pressure/flow/volume gradient down which blood flow will be directed toward the tissues that most need it.
So as exercise intensity increases and blood flow becomes limiting to muscle O2 uptake (mVO2) at the quads in cycling or running, we will see:
-
Relatively less oxygen delivery to non-locomotor muscles, eg. deltoid, forearm. (upper limb blood flow actually increases during leg cycling, but just to a much lower extent than the legs, obviously)
-
Increased recruitment of non-locomotor stabilizer muscles, eg. delt, forearm, paraspinals, etc.
-
This combination would facilitate higher O2 extraction at the non-priority tissues, and so SmO2 (being the balance of O2 delivery and O2 uptake) will begin to decrease, as local uptake > delivery.
Empirically, we use non-locomotor muscles to inform systemic threshold/breakpoint detection along with the oxygenation profile of the primary working muscle (eg. VL in cycling, RF in running). This has not yet been established in the literature (we’re working on it ![]() )
)
3 Likes
Here’s a sneak peak of a figure from one of our manuscripts currently under review, comparing the respiratory compensation point (RCP, ie. VT2) to the deoxy-breakpoints assessed at the VL and Deltoid during an incremental ramp cycling test.
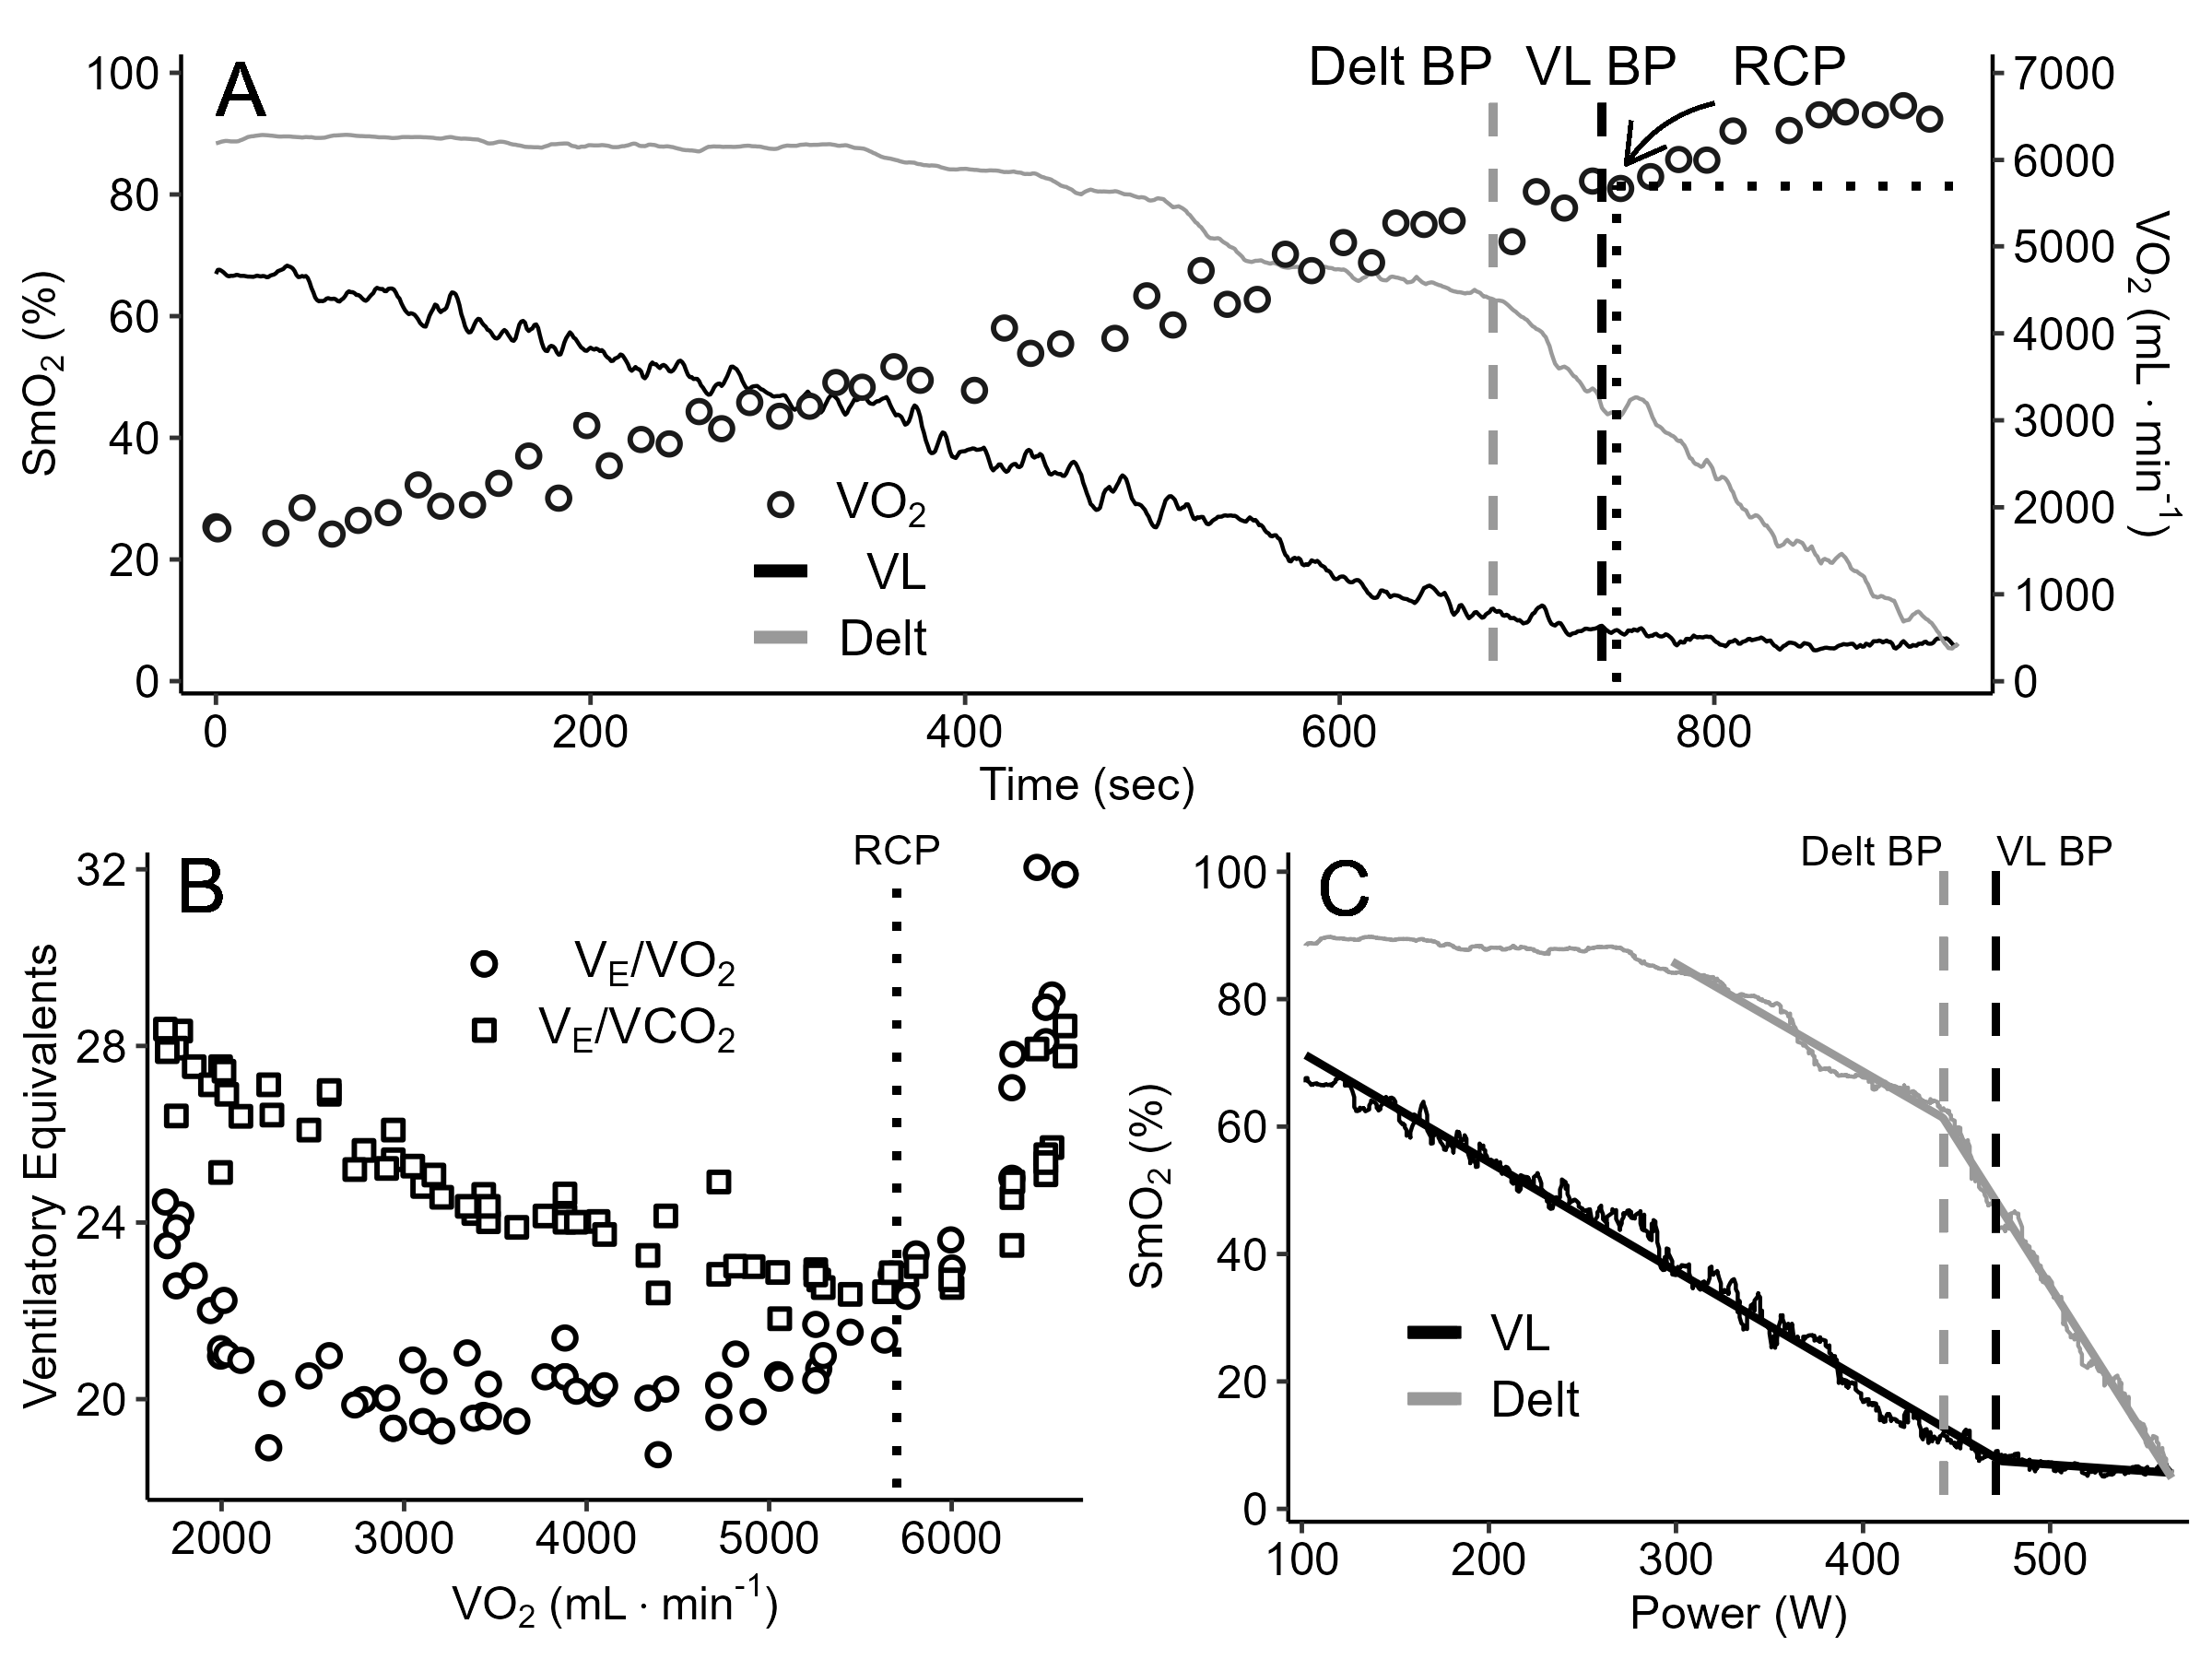
Our abbreviated conclusion is that in this sample group, there was no statistical difference between RCP and either deltoid- or VL-derived deoxy-BP in this ramp protocol. And in fact, there was a trend toward closer agreement between the deltoid deoxy-BP and RCP.
However, there was extensive individual heterogeneity, in that some subjects showed close agreement between breakpoints, while others showed very poor agreement in either direction, by ± ~60 W or ± ~10 ml/kg/min VO2. Meaning evaluating the Deoxy-BP was not a good proxy for determining the RCP in this protocol.
However, an incremental ramp test might simply be the wrong protocol to use for muscle oxygenation. All threshold measurements are protocol-specific (LT is different from VT is different from MLSS is different from CP… etc.). A ramp test is designed for pulmonary gas exchange VTs. Therefore, a more appropriate NIRS-specific assessment protocol may improve it’s use for the detection of intensity domains and for training prescription.
Edit: Forgive me for a final flagrant but relevant self-promotion: I’ve been chatting recently with Sean Seale of Upside Strength, a bilingual French/English podcast, on muscle oxygenation trends. We touched on non-locomotor oxygenation trends in a recent episode, and we’ll be circling back around to it soon.

4 Likes
@SpareCycles Thanks for posting that podcast Jem.
I listened to it on my way to the ice rink this morning and put the theory to the test:
- as soon as my back signaled a slight strain, I eased of the power on the straights, assuming it was an indicator of upcoming lactate burn in VL and needed to clear it before being bitten by it.
- as I forgot to bring my Polar H10…it was a great way of gauging intensity too.
- this ‘back sensor’ seemed to have improved my average lap time.
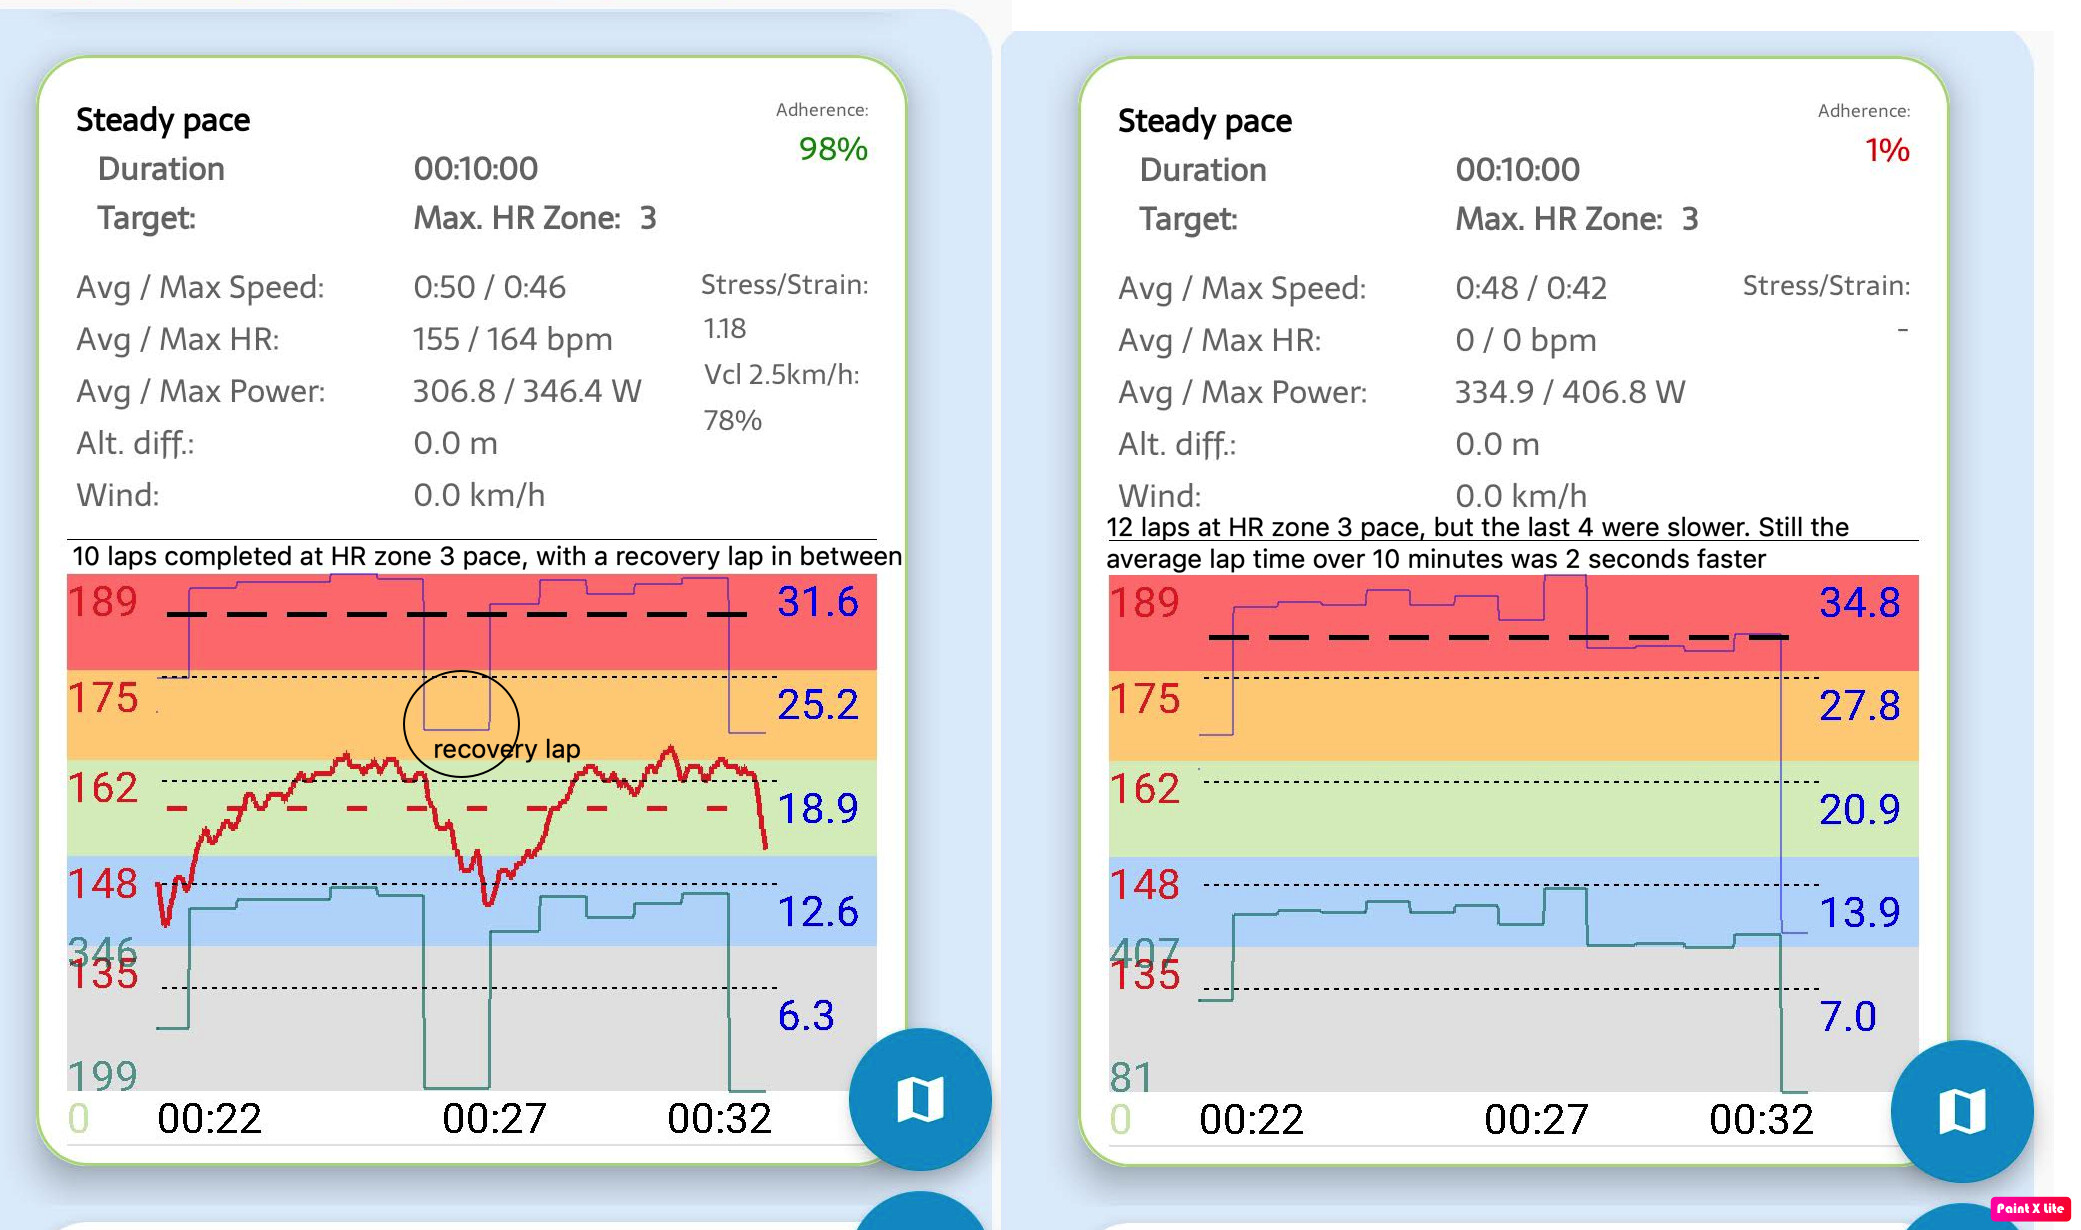
In the image below you can see a comparison between 2 training sessions with the same plan. On the left, 2 days ago, on the right, this morning.
The ‘steady pace’ section comes after a 10min warmup and 10 minutes of alternating between ‘low stance until the lactate burn’ followed by a lap of recovery.
The intent of the steady pace section is to build endurance and learn to pace at a maintainable speed. On the left you can see that ‘HR zone 4’ correlates well with my lactate production.
On the right I used ‘back strain’ as an indicator of upcoming lactate burn. As the graph shows, i reduced my pace with about 4 seconds per lap (40-50 watts) to prevent the burn. No ‘in between recovery lap’ was needed to complete the section. This resulted in an average improvement of 2 seconds per lap for the whole 10 minutes.
I can imagine that my HR remained just below zone 4 this morning as a result of the ‘back sensor’.
I heard you say in the podcast that your are coming to The Netherlands. Welcome!
You might want to visit the Thialf Innovation Lab (https://innovatielab.thialf.nl/). These people work together with the top skating teams to develop the sport. As (middle distance) skaters are always fighting the lactate enemy, the moxy learnings might help them to pace their race better. (learn in training with devices, put to practise in racing).
The Jumbo-Visma team with coach Jac Orie always seems to be in the mood for some scientific experiments. They work together with universities to do their research.
1 Like
Wow, super interesting observations. Thanks for posting that!
I have minimal experience with speed skating (I worked as an athletic trainer for a single weekend a number of years ago, and was terrified when they told me my main job during the races was to stand at the corners with essentially a full trauma kit in case of bleeds ![]() ) So I hadn’t thought about the use of Moxy on the paraspinals for speed skating, but yeah it seems like it would be very relevant. I’ll definitely reach out to the resource you linked while I’m over there this summer. Dank je wel!
) So I hadn’t thought about the use of Moxy on the paraspinals for speed skating, but yeah it seems like it would be very relevant. I’ll definitely reach out to the resource you linked while I’m over there this summer. Dank je wel!
This is fantastic. Great approach. Would you move into a more upright position when you started feeling the burn, to reduce the tension directly on the back? Or just reduce the power while maintaining the same position, which I guess would reduce the transmitted forces the back needed to stabilize against? And was this sufficient to decrease, or stop the progression of the burn?
The next step could be to start at a slightly lower pace based on where you started to ‘accumulate’ the burn, to see if you can maintain that slightly lower pace more consistently across the entire 10-minute duration. It sounds like this workout isn’t intended to be maximal effort, but see if you can progress the sustainable pace to finish faster than when you started with the same RPE? What do you think?
In my own personal experience using Moxy in cycling I’ve also found that the data lines up very well to the sensation of ‘burn’ (I hesitate to call it ‘lactate burn’ as it’s probably more related to the acidity and hydrogen ions [H+] rather than lactate per se, but I totally know what you mean ![]() ).
).
In fact, after a few uses of Moxy to understand how the signal profile corresponds to sensations, I was basically able to regulate my own intervals based on sensations without needing the Moxy at all. I would then occasionally use the Moxy to re-calibrate my perception of effort across HR, power, muscle oxygenation, occasionally VO2 and blood lactate, and most importantly RPE. To make sure I was working within whatever intensity domain I was aiming for.
I say this to suggest that, despite my (our) justified love for all the fancy data collection and quantified monitoring tools, I strongly think we should be using these devices to ‘dial in’ our perception of effort and to better understand and predict our sensations, in order to predict our exercise tolerance. Just like you showed here.
That being said, here’s a good framework for using Moxy to regulate repeated sprint intervals ![]()
2 Likes
@SpareCycles thanks for all of the great information way more than I have access to!
@shawnfife were you on rollers?
I was on a smart trainer in erg mode.
I had a harder time controlling my cadence that day compared to other tests.
@SpareCycles
Jem, I am happy to perform any other tests/experiments, if you feel like they would be helpful to continue this discussion on the forum.
1 Like
For the sake of this experiment I did not change my back position. Otherwise we could debate whether it was ‘zero oxygen’ strain or ‘some other form of strain’.
And yes, just easing off the power did relief the back strain indicating the theory actually holds true.
I should stress that I am not a professional speed skater and nobody was monitoring my actual position (versus my believes). There are many possible reasons for back strain, but I tried to rule them out by having extreme focus on my technique during the experiment.
When done right, there is very little tension in the back muscles during skating as your are supposed to ‘hang from the hip’ and use the abs to stabilise the spine on the pelvis. Well…that’s the theory ![]()
I thinks the same thing. The corners make it hard to find the right pace though. The inner corner power requirement for a constant speed is about 42% higher than the straights. This means I can watch birds…if there were any…on the straight and then push it in the corners. The 100m straights are too short to recover from the HR increase happing in the 100m corners.
To complicate things: the corners require type 2 fiber activation / are anaerobic at this pace.
The below image illustrates the power requirements for a ‘flying’ lap at 43 seconds per 400m:
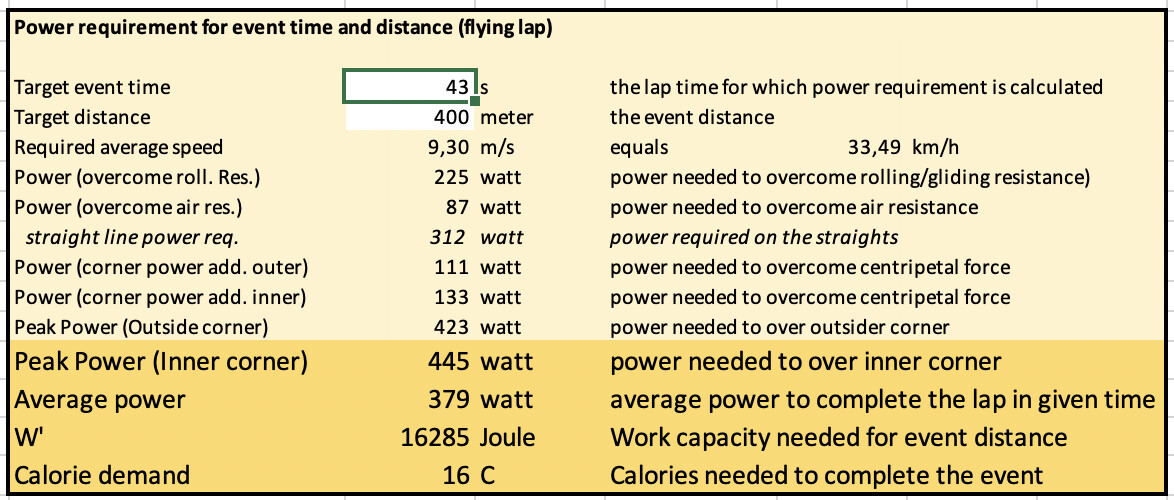
This, and the indoor cycling ramp test, estimate my FTP around 270-280.
A lap time with an average power output of 270-280 is completed in 55 seconds, at which I can maintain HR zone 2, suggesting it is all aerobic then.
As a disclaimer. Cycling power is very different from skating power. Skating can be more efficient, the stride rate is smaller than the cadence…not really comparable. The calculation above simply takes ‘accelerated mass formulas’ as the basis. I am not sure i can hold 334 watts for 10 minutes on the smart trainer…in hr zone 3 (of 5).
Regardless of what causes the burn, while skating I usually run out of W’ before the VL actually burns. Must be the combination of straights and corners.
Just this week, (twice a day experiment, see other post), i learned that it’s much easier to ‘push until failure’ on the smart trainer than on ice skates. On skates the technique fails first…leading to that horror you described :D)
Same experience here after lots of structured training and structured analysis, but then with HR instead of o2.
I noticed that group skates/rides are fatal for the perception.
1 Like
Well this has turned into an awesome little post! Thanks everyone
I was just going to start a simple example of the ability to find upper threshold from a non-working muscle.
There are lots of uses for muscle oxygen and some great examples here already.
I think @SpareCycles has it all covered!
2 Likes
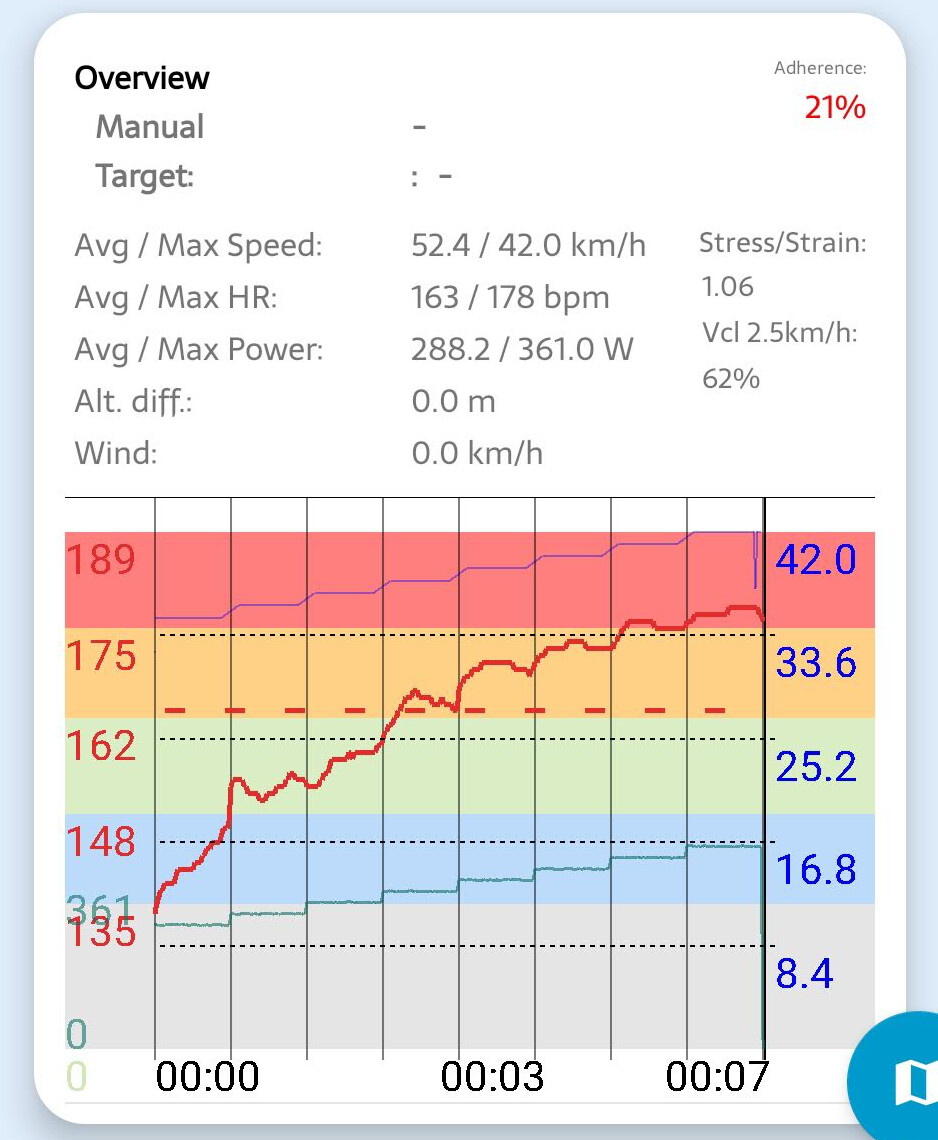
Another attempt, now while wearing the H10.
I again tried to pace based on my ‘back sensor’ and not HR.
As a learning from the previous session I eased off the pace on the straights some more to ‘recharge’ for the corners. The strategy worked. I gained another 5 watts on average.
HR was well into Z4, but the ‘power management strategy’ seemed to prevent the loss of control.
This experiment is really providing ‘pacing confidence’ → by accepting the body signals, the end result will be better.
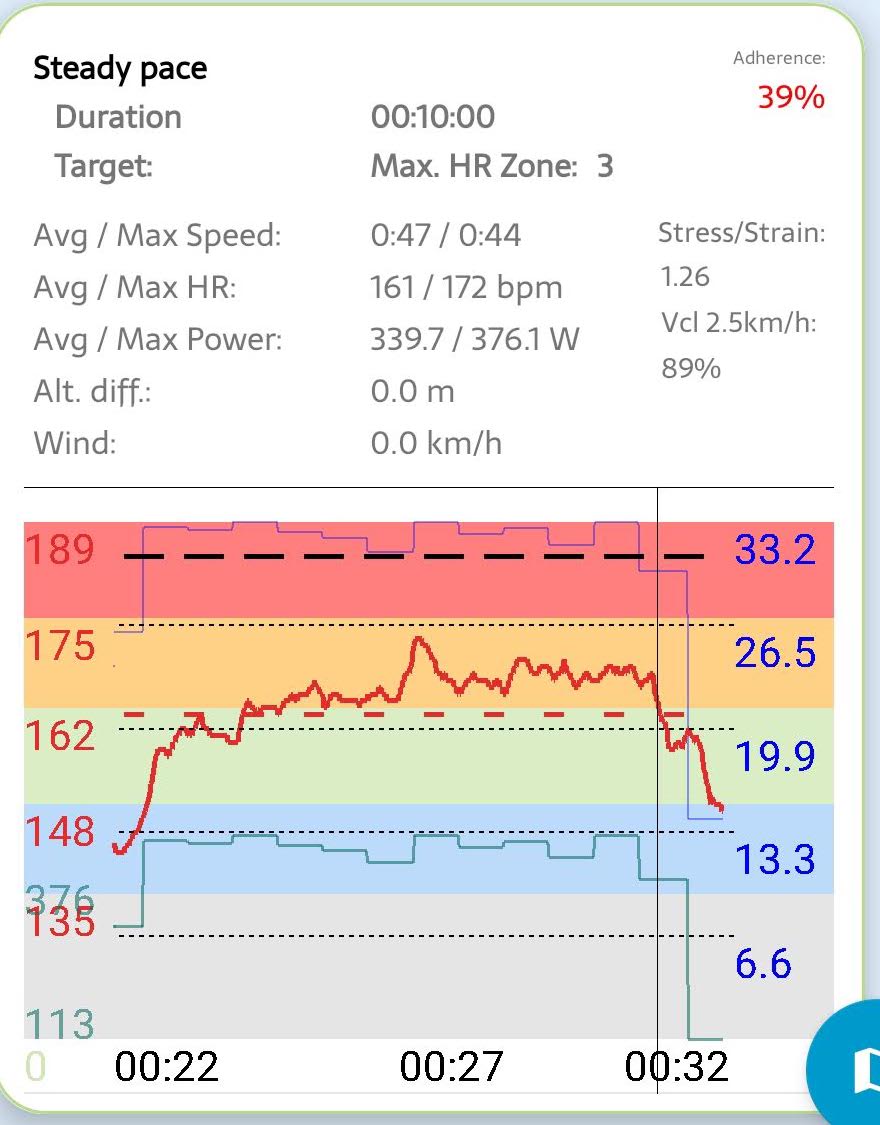
Interesting to note: Vcl is improved from 78% tot 89% (Vcl = Velocity Control Limit = how much of the data points are between 2.5km/h above the average and 2.5 km/h below the average))
From a ramp test:
Interesting to see that HR goes up with every step in HR zone 4, and then stabilises a bit lower. Something that does happens less visible in zone 3, and inversely in zone 5.
Can we explain this through smo2?
You can get insight into many things from looking at smo2 in reference to others. As I mentioned earlier these heart rate changes are often compensations for respiration limiters. You can start to determine respiration limiters with a moxy but you can only get the real details from a metabolic cart.
Without even getting into the full details here are two examples of what I see in athletes 90% of the time (or maybe even more).
First test is Vital capacity test - to determine FVC and FEV1.
This relationship in medical comparison should be at least 75% but preferably 80%.
Athlete A - Leadville under 9h 48 years old male
Athlete B - Top 7 consistent mtb cross country athlete 24 years old female, up and coming racer.
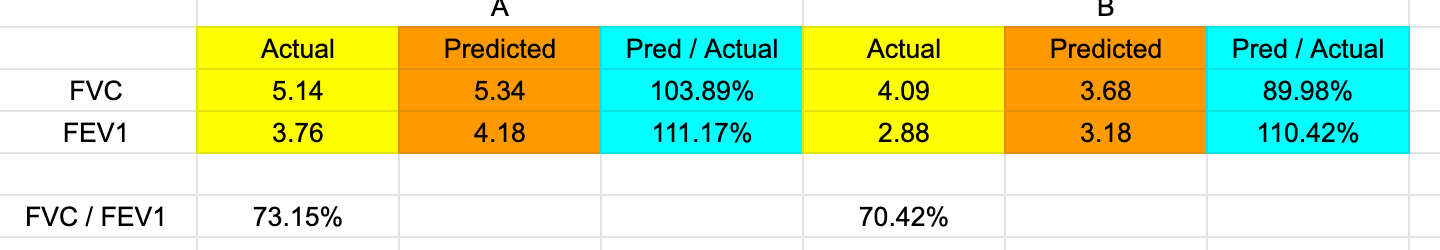
You can see that both athletes are limited by their FEV1 and their FEV1 ratio by 2-7.5%.
This is very normal.
I had a longer post about this but quickly, if you can’t breathe out, you can’t breathe in. FEV is Forced Expiratory Volume. So if you have this limiter it will be exaggerated during sport.
Each athlete during a step test will have places where their respiration is stronger and weaker when they haven’t trained their respiration.
Generally speaking the harder you are going, the more respiration will be compensation.
So during the step test when you see your heart rate re-stabilize during a step respiration is probably in line with work, when you see the heart rate rise during the step your respiration is probably limited and your heart rate is compensating.
3 Likes