Is this WKO chart available?
And why might this way of looking at strain be better than the common way of looking at decoupling (using Pw:HR)? Measuring drift over time.
Is this WKO chart available?
And why might this way of looking at strain be better than the common way of looking at decoupling (using Pw:HR)? Measuring drift over time.
Hi @tshortt,
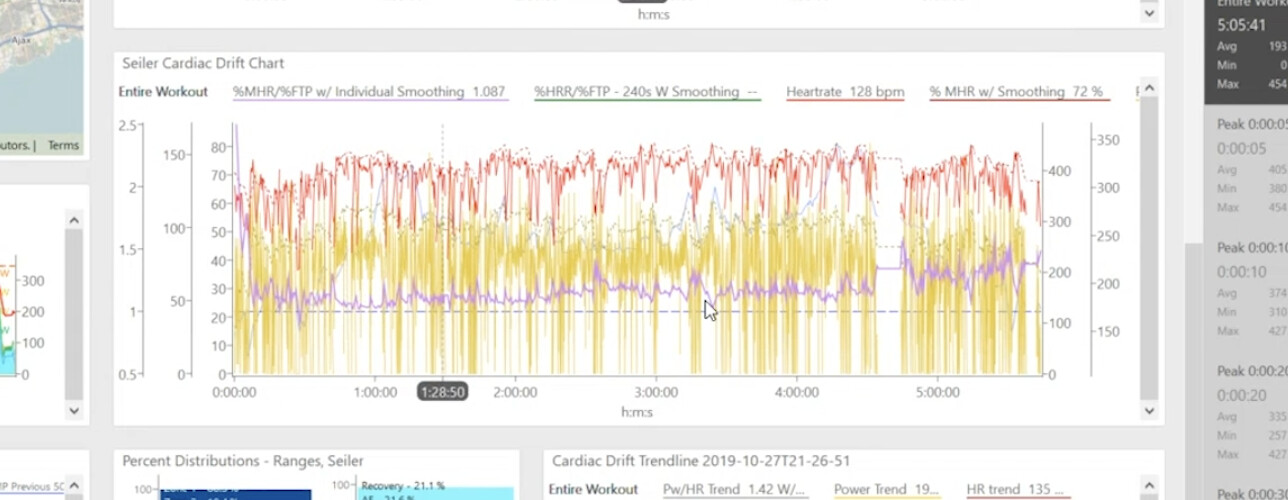
I have to ask, did that chart pop up on one of our videos? I ask because it’s a chart I intentionally haven’t addressed because it was an experiment that only sort of worked.
Dr Seiler built a version in Excel that we were using to look at cardiac drift trends. I wanted to see if we could build it in WKO. I got it part of the way there, but the problem is it relies on variables that you can’t reference in WKO (such as resting heart rate and five minute power.) I was able to build the chart by hard coding my data into the expressions, but as a result the chart only truly works for me and even then, I would have to go into the expressions and constantly change the numbers to keep them up-to-date.
Once WKO has resting heart rate and five minute power as variables, I’ll make a version and share it.
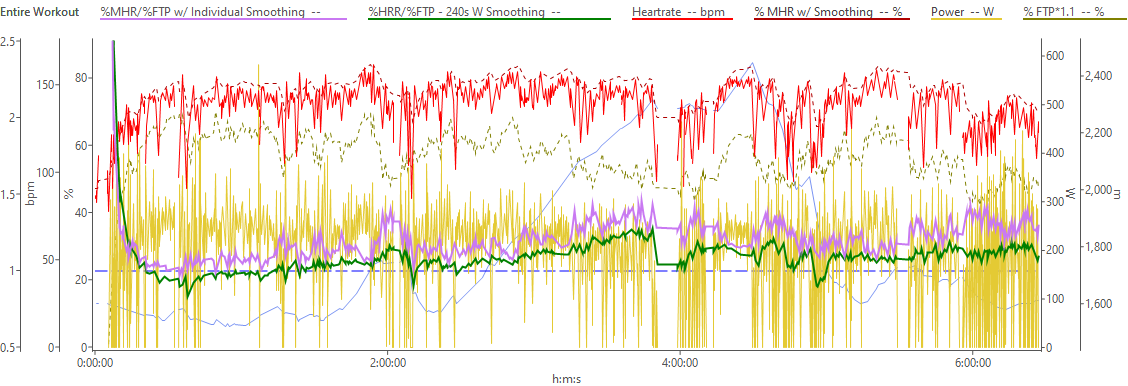
To answer your second question, the issue with Pw:HR is it just looks at the first half of your ride and compares it to the second half of your ride. So you get a gross change, but it doesn’t show the nuances throughout the ride. If I could get the graph to work, that purple line would show the real time changes in power-to-heart rate. For example, you’d be able to see when decoupling really takes off. That said, you do sort of see it in the graph above - there’s a slow rise until about 4.5 hours, then the athlete took a short break and after that the drift was much higher.
Here’s a better example:
The purple line was my first attempt and the coding had issues. The green line is better. Notice how at the start of the ride the green line sits on top of the dotted “1” line (when there’s no cardiac drift and all of your variables are accurate, you should be at 1.) Around 3 hours into the ride I really started to suffer and ultimately cracked and took a rest. You can see the rise in cardiac drift as I was cracking. After the break (and some food/drink) it was better but never returned to one. Can’t see those dynamics in Pwr:HR
Hi @trevor,
Thanks for you response and explanation. Great content in the workshops and articles.
Yes, you talked about it in this video with Ryan. You were showing a ride you did with Chris where you (humorously when you told the story, maybe not so humorously on the ride) “wanted to see which one would crack first”. LOL.
How to Determine Your Cardiovascular Drift - Fast Talk Laboratories (@ min 8:45)
I saw that green line and thought ‘that looks like the thing from Seiler’s Load, Stress, and Strain video’. Load, Stress, Strain: Understanding the Difference Can Make You Fitter and Faster - Fast Talk Laboratories. (@ min 21:13).
I thought it must be a rolling average (30/60 secs) and that I too could reverse engineer it in a WKO chart. Understood that you have to hard-code some values in there to get HRR.
Makes sense. ![]()
Yep, totally agree. That was my motivation asking. I see this as potentially a more valuable/sensitive metric than Pw:HR first half/second half comparison.
HI @tshortt,
Glad that helped! We did use a rolling average but it was actually a little longer… 240 seconds. It’s actually not too hard to reverse engineer the graph. Just have to wait to have all the variables in WKO
Thanks!
Trevor
My attempts, all averaged over 240 seconds
MHR:FTP
(filter(heartrate,{1:240},1)/bikemhr)/(filter(power,{1:240},1)/sftp)
%HRR Smoothed
filter((heartrate-40)/(bikemhr-40),{1,240},1)
%HRR:FTP
filter((heartrate-40)/(bikemhr-40),{1,240},1)/(filter(power,{1:240},1)/sftp)