Is there a way to get a sense of whether your lactate clearance capabilities have improved with a block of training? If the lactate curve shifts then we know we’ve “gotten better”, but lots of things can explain that. Is there a way (with lactate or otherwise) to measure or indirectly gauge improvement specifically with regard to clearance?
Hi @tshortt, great question. Yes, there are ways to do this. If you are using lactate, you can definitely look at that rightward shift in the curve as one indication of improvement. Another would be lactate response at the same intensity (e.g., 2.1 mmol/l at 220 watts versus 1.3 mmol/l at the same power output).
Without lactate, I think it takes a little more interpretation of the training/performance data and monitoring. If we track power/HR over certain time periods, we can gauge improvements as we will be able to hold certain efforts longer as those lactate numbers improve (i.e., improved fat oxidation, mitochondrial density/function, etc.).
One metric I’ve used in the past was kJ’s during a ride. I could almost set my watch by the timing of my cramps in MTB races, and it wasn’t until I improved my fitness (threshold, endurance, etc.) and saw reductions in lactate that the cramping either subsided completely or took much longer to occur (i.e., I could do more work and could accumulate more kJ’s per hour), suggesting a good improvement in those clearance capabilities.
Coach Ryan
3 Likes
Timely thread, I was just about to post some ride data for interpretation by the physiology data geeks!
My workout today featured a four step ramp from 165 W to 195 W, then immediately into 5x 2 min at 95% FTP (250 W) with 30 sec recoveries at 185 W. The intention here was similar to @trevor’s (in)famous 5x5 where I am doing insufficient recoveries to work on lactate clearance. Following the 5x2 min, I ramp back down following the same trajectory as the ramp up.
What I find very interesting here is that I see a hysteresis in my heart rate response pre and post intervals. That is, while during the ramp up my heart rate is pretty low and doesn’t really move until I hit 195 W, on the way back down it stays quite high until at about 50’ where I had to skip an ad on YouTube 
So what am I seeing here? My thought is that I accumulated a lot of lactate during the threshold intervals, which is being burned off at a rather slow rate during the ramp down. I did eat breakfast before doing this, so I was certainly replete with carbohydrates, so possibly I was preferentially using glycogen rather than lactate. Or it could just mean that I need to work on lactate clearance with over-under type intervals.
Thoughts? Am I on the right track with my thinking here?
1 Like
Hi @SteveHerman, Sorry for the short response. A lot of what you are seeing is what’s called oxygen deficit and oxygen debt. Oxygen deficit is due to the fact that it takes time for the aerobic pathways to “ramp up” so early on in a workout, you need to rely more on anaerobic pathways while the aerobic pathways kick in.
Oxygen debt is more complex, but the short explanation is that there’s still a lot of byproducts to clear out and your muscles are trying to replenish their energy stores (particularly anaerobic sources) so oxygen demand is higher than what’s needed just to perform the current work.
What I’m seeing in your file is pretty typical. All cyclists see that effect. Though the ramp up of your heart rate during the intervals is on the slower side. That tells me that you have a lot of opportunity in building that aerobic engine.
Hope that helps!
2 Likes
Thanks for the analysis. I have been fascinated with erg mode and the precision of the data it can help me generate! I’ve never really noticed the hysteresis effect caused by this oxygen debt issue. When the aerobic system is really humming, should I expect to see the heart rate ramp up and back down more quickly?
When you are aerobically very fit, you should see the oxygen deficit and debt reduced. This is a simplification, but oxygen deficit is caused when the aerobic system is slow to respond and oxygen debt is caused when there was a high anaerobic contribution and anaerobic energy stores need to be replenished.
@trevor What is the physiologic explanation for why lactate clearance is best trained at intensity just sub threshold? I’m not implying you’re wrong, just curious why higher lactate levels, say above threshold, wouldn’t be more of a stimulus for the mechanisms to use and clear lactate.
I don’t want to speak for Trevor, but will add my thoughts to your question @robertehall1.
It’s really a question of balance - where is the lactate coming from primarily? Where is the lactate cleared primarily? And what is the balance of these relative to our metabolic work being done (e.g., how hard are we going relative to our aerobic and anaerobic thresholds?).
Lactate clearance is done heavily by the slow twitch fibers (Type I). As you go hard and accumulate lactate, the fast-twitch fibers, which are recruited at higher intensities, produce more lactate, and then export it out of the cell via specific transporters. It’s the slow twitch that can take it up and “clear” it. These fibers are recruited progressively as intensity increases. So at your recovery pace, you are relying heavily on those slow twitch fibers with very little fast twitch contribution. As you gradually go harder, more fibers get recruited to produce the work. It’s not an on/off switch; rather, it could be thought of more like a slider - harder, you bring in more of the fast twitch, easier, and you rely on fewer, and this changes the metabolic contribution of fat vs. carbohydrate, which in turn changes the amount of lactate produced and exported out of the cell into the blood.
I’ll suggest that with Trevor’s comment on clearance being best trained just below threshold is because we are riding that fine line (remember that it’s a balance, so we’re right on the edge there), and by sitting right below that line we are still working hard enough to produce moderate amounts of lactate, but we are also riding light enough to reduce stress on the system such that clearance can take place by those slow twitch (aerobic) fibers.
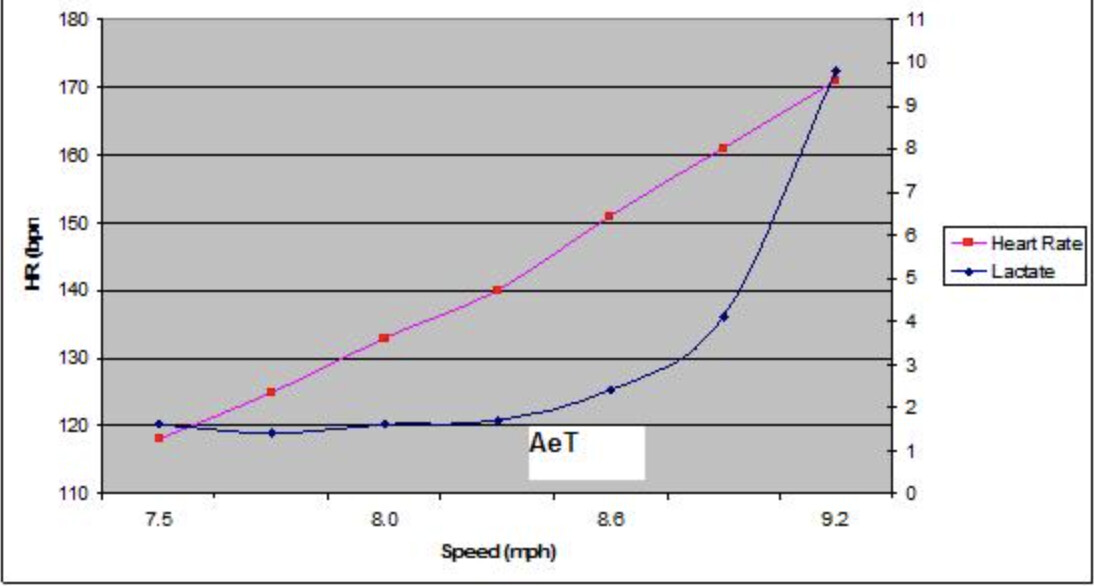
I stole a quick snip of a lactate curve from the interwebs to highlight this point. If we use the blue 4mmol mark (secondary y-axis) and use that as threshold (commonly called OBLA), then we can see beyond that point (8.9mph) lactate accumulates at such a rate that there is no way we can clear it at that absolute speed. However, below that pace, lactate is increasing at a lower rate, so if we go sub-threshold and say maybe 8.6mph as the sub-LT effort, then we are able to slow our metabolic rate down enough to allow lactate to be cleared by those slow twitch fibers.
I hope that helps a bit!
Ryan
1 Like
That makes sense. Thanks for the detailed answer!
Hi Rob,
Short answer is that as you go harder and harder, your body is going to try to increase blood flow to the working muscles and constrict blood flow to other tissues. So, at really high intensities, your ability to clear lactate is reduced. This has been studies a lot - it’s easy to find graphs of lactate clearance, but because of that peripheral vasoconstriction, lactate clearance is maximized just below threshold.
2 Likes
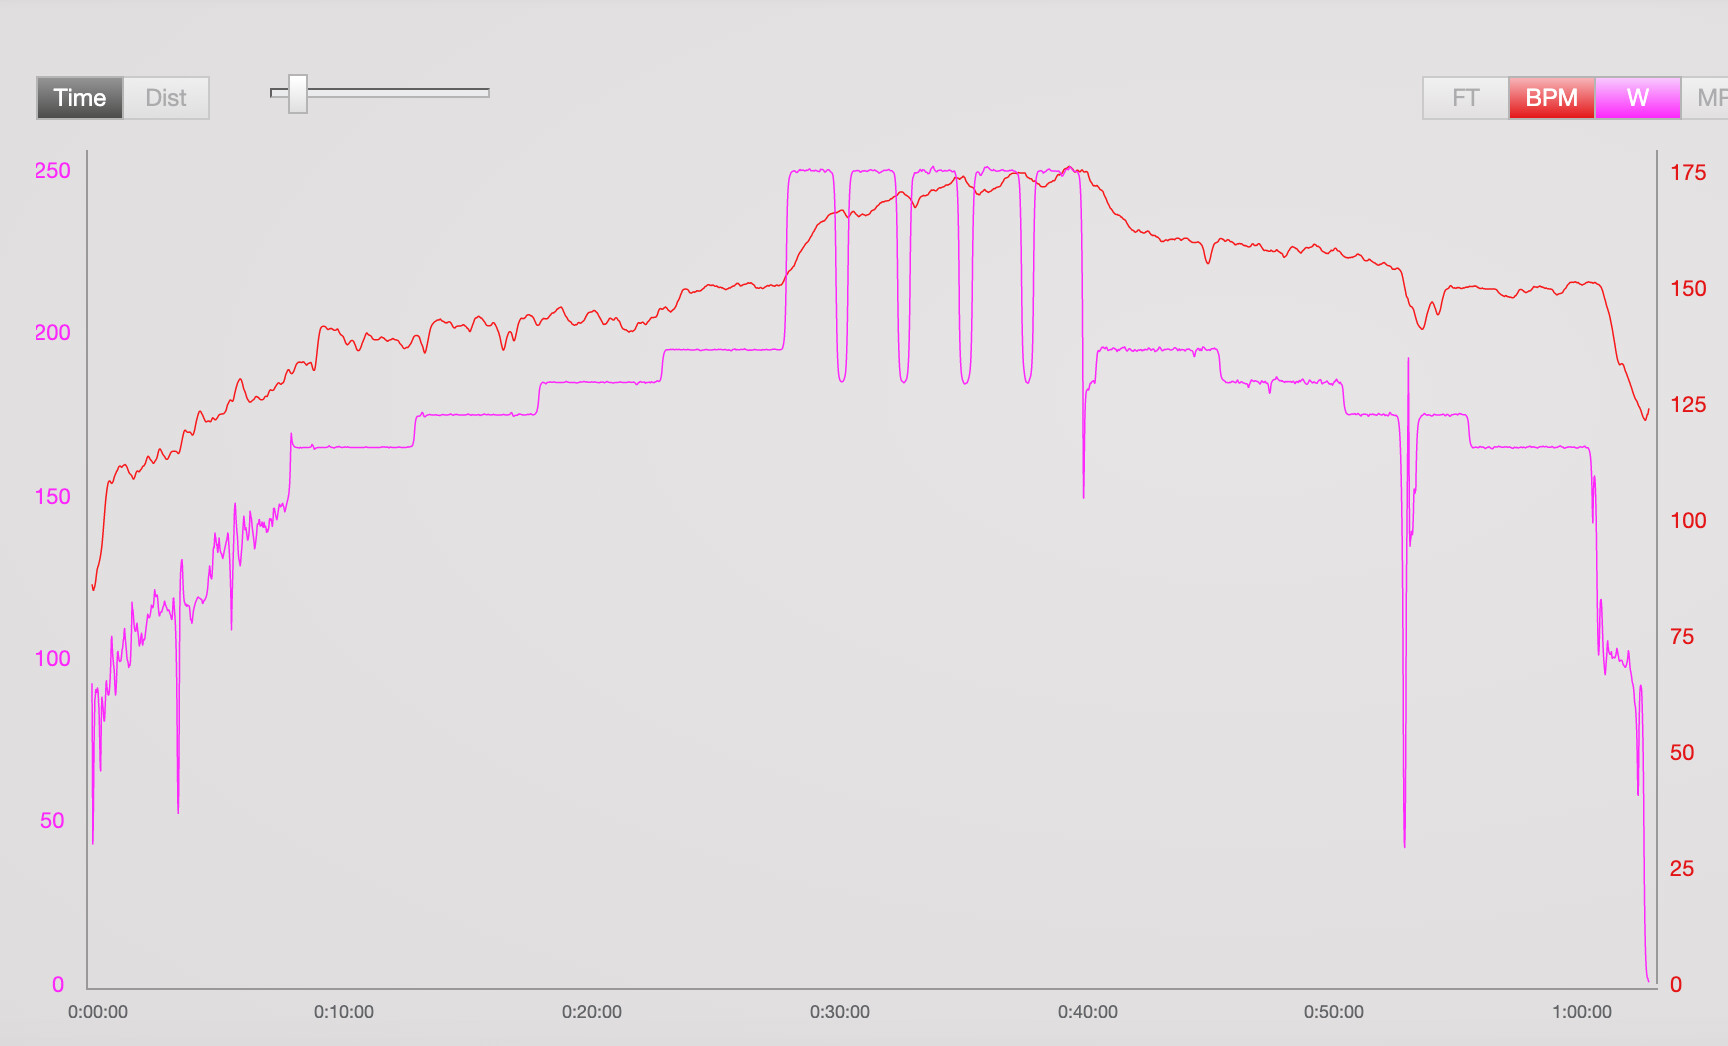
I’d like to jump in on this discussion–perhaps a year too late? I’ve been fiddling around a lot more with BLa readings during my workouts, and decided to do a bit of a hybrid ramping protocol last night.
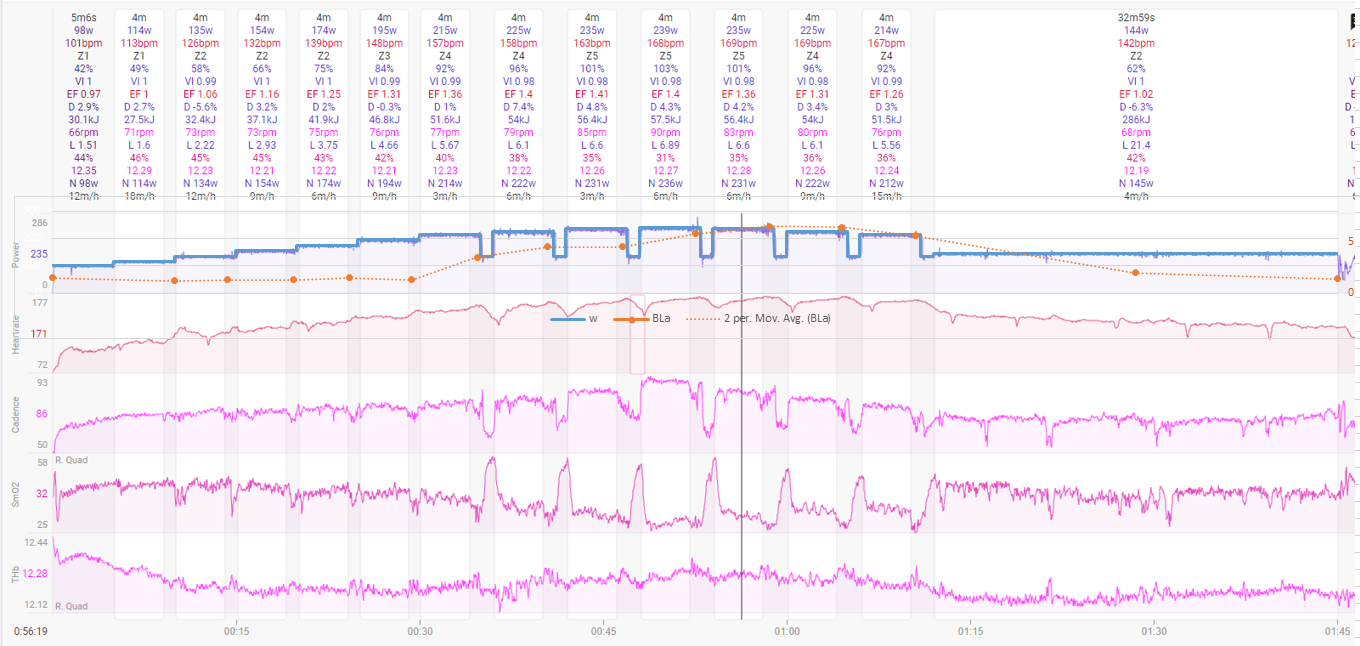
Knowing that my things start to change for me around 185W mark (+/- 10W) indoors, I structured my workout in 5 minute ramps hitting targets of 100/115/135/155/175/195/215 continuously, and then continuing in 5 minute steps up and back down at 225/235/240/235/225/215 with 1m 135w recoveries–I’m guessing my hour power is probably ~225-230w. After 4 minutes at each level, I took a BLa reading.
As you can see from the attached picture, there was a very clear ramp in BLa around the 195-215W area, going from ~1.4mmol at 195W to ~3.5mmol at 215. It stablished around 1.5mm at the 225W and 235W intervals, but climbed to 5.8mm at 240W. Interestingly, it continued to climb and hold steady ~6.5mmol as I ramped down the power to 235W and 225W–this despite 1 minute recoveries. It had begun to decline some, once I brought power down to 215W. However, what was surprising is that it was still at 2.0mmol half way through my 33 minute steady state 135W “cooling off” period. At the end of that interval, it finally came down to ~1.4mmol.
I was surprised by how long it took for me to “clear” the excess lactate my body produced, and more specifically by how little had been cleared in that last 215W interval. SMO2 looks “stabilized” around the 225W intervals, both up and down, which seemingly indicates that could be approximately my MLSS. I’m not sure what to make of the differences in the HR, other than it could be due to my body working harder to clear the excess lactate, and/or some fatigue setting in, and/or some dehydration setting in–regardless, it is a clear indication to me of some addition taxation of my cardiorespiratory system.
Key questions I’m left pondering:
- is my situation “normal”, and what does it say about my current cardiovascular and metabolic fitness?
- how long should it take for the body to clear excess lactate?
- does knowing this help in formulating racing tactics/strategies?
- does it really mater if lactate is not clearing faster, providing more is not accumulating?
- what types of training could improve lactate clearance?
Background:
Male, low-50s, ~95kgs, 1.83m, with an irregular ~6 to 7 hrs/week of training in a polarized structure. Until August 2021, the previous 2 years would have had me 6kgs lighter and with 10-14 hrs/week of consistent training in a pyramidal structure working with a well known coach.
Hello @wbendus could you please email the fit file for this session.
Few things.
It looks like you were doing a pause (like a moxy test) correct?
You were taking lactate readings at the end of each step (but not beginning and end)?
You did change your cadence during the steady pieces…in order to look at this lactate you should do two things.
Same working with same cadence during the session.
Another session, warm-up as you did, hold 185w but ride at 60-65-70-75 and so on cadence up to at least 95, taking a lactate every 5m. This will give us a lactate curve relative to cadence, you will likely learn a lot from this.
Send the fit file, and the corresponding lactates, I need to put this in my software to respond, the detail isn’t good enough with the moxy readings in icu.
@steveneal Those rests were actually 1 minute “recovery” interval at 135W at ~65RPM.
I took a BLa just before starting the workout, and then at around ~4:10 in to each of the 5:00 (minute) intervals. I.e. 4 minutes of consistent, steady work prior to sitting up to take the BLa. Sitting up obviously impacts SMO2, HR, and cadence, especially as I am distracted with the process of getting the reading.
I did slightly increase, then decease the RPM of the intervals, such that 215W was at ~76-77 RPM, 225W at 79-80 RPM, 235W at 83-85 RPM, and 240W at 90RPM.
As you suggest, I will do a session tonight at 185W and work through the cadence ranges with BLa every 4:45 in to 5:30 (mins) intervals–cadence, HR, and SMO2 will necessarily be disrupted while I take the BLa readings.
I expect that I’ll see some modest tick up in BLa as I pick up the cadence at a constant power? If I do, I will then wonder if it’s because of poor conditioning, or because of increasing cadence? That said, I do have a recent 80 min workout holding power at ~165W, and cadence steady around 78-80 RPM where BLa held pretty stable throughout–1.7, 1.9, 1.2, and 1.5 at each 20 minute mark, respectively.
I’ll shoot you both files after I’m done.
if you could send the first file from this post first and not at the same time I would appreciate it.
Hi @wbendus
Re-did the graph with the most recent info you sent.
The 1.8 lactate I have put a box around has to be incorrect based on what is before and after it.

I think if you want some more advice, a 4-5m step from 100w to 250w with a cadence staying within 5rpm of what you are comfortable with would be better.
From this session, the lactate data is a little off due to the cadence changes mentioned.
If I just look at the moxy data.
Looking at the cadence during the step (in black) you will see the effect it has on the moxy.
I would highly recommend staying within a few rpm and really constant on the cadence and power when wanting to use the moxy for identifying zones.
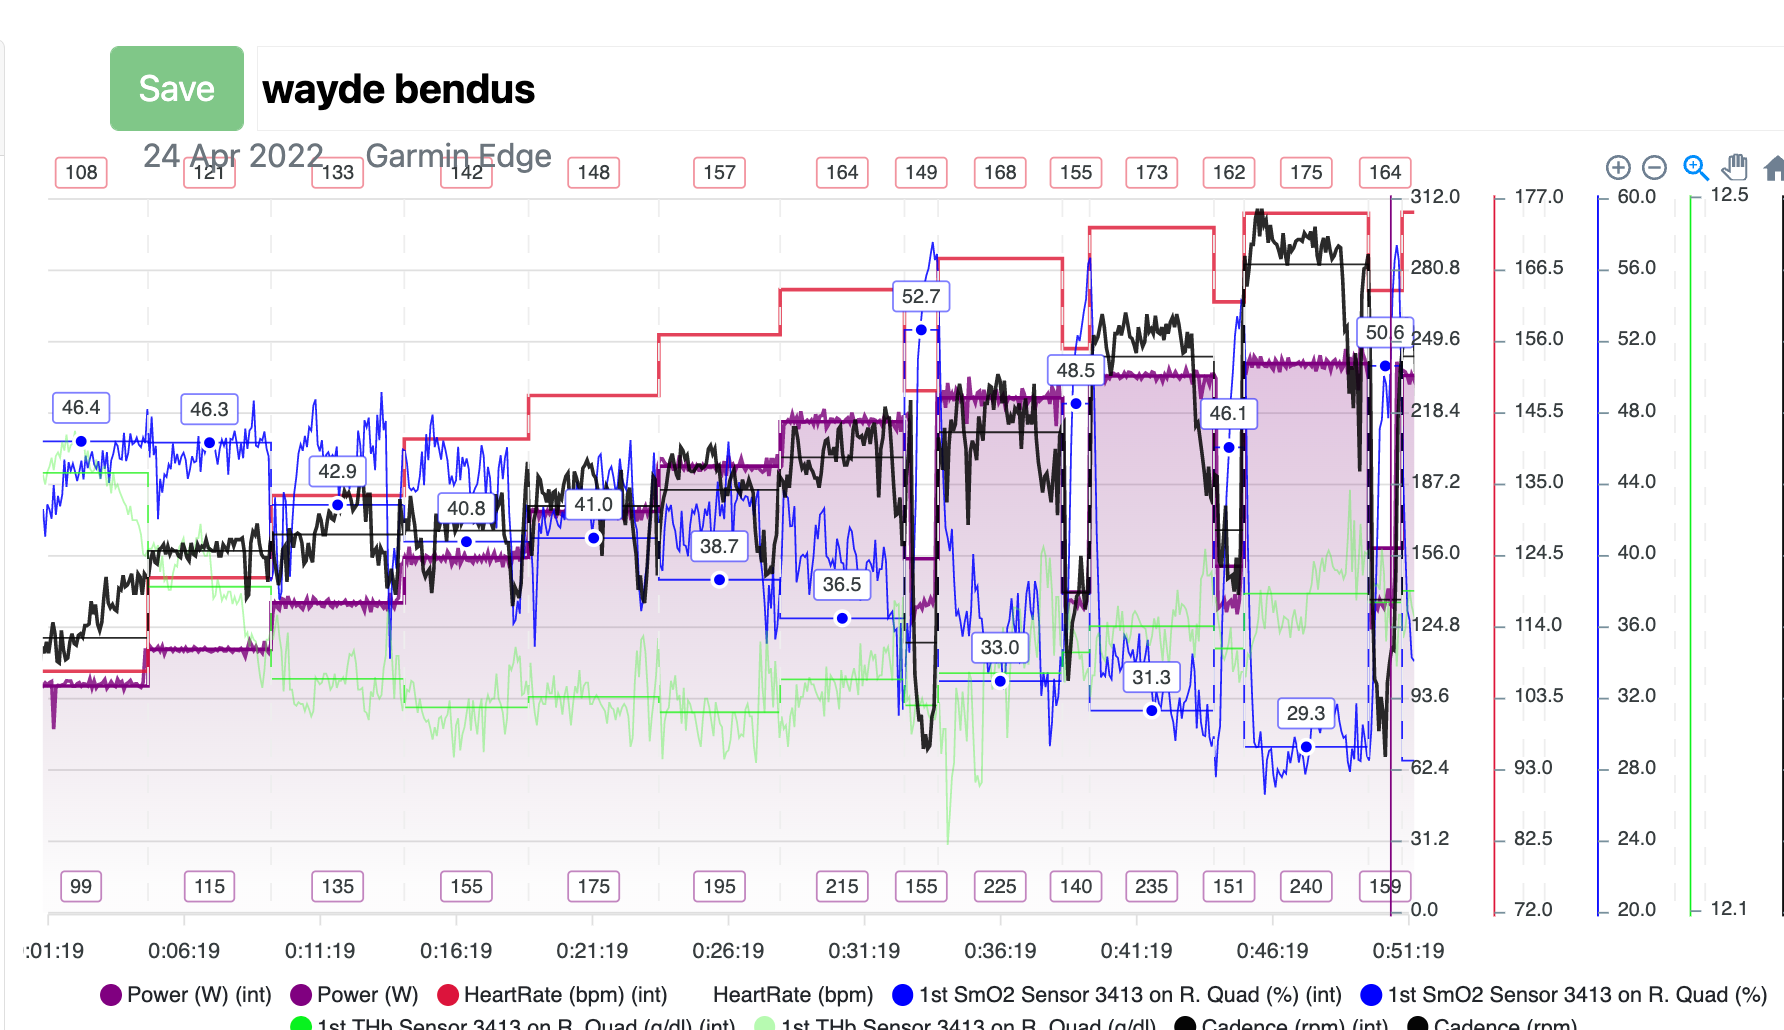
When we are looking at the moxy to identify zone or intensity changes, we want to be looking for positive slope relative to power, steady, or negative slope relative to power, but you will see your steps are a little jumpy.
The other way I can look at this file is to look at the final 60s avg of each step below.

From this data (not ideal but pretty good) I would say 175 would be a good spot for endurance on this day.
So if you can get a file with consistent cadence (this will help both moxy and lactate data) 4m steps…maybe 5m from 100-250w in 25w steps that would likely be a more clear picture.
The lactate level up to 235 is excllent but I do find it interesting that it is so stable showing a moxy decline, often the moxy will be an inverse of lactate.
Steve
I believe I had a large bowl of cereal with milk just before getting on the bike. The lactates look a little off. Here’s the data I pulled:
| Time | Pwr | HR | BLa | SMO2 |
|---|---|---|---|---|
| 0:00 | 65-69 | 1.5 | ||
| 0:09 | 115 | 113 | 1.2 | 46 |
| 0:14 | 135 | 126 | 1.3 | 45 |
| 0:19 | 155 | 132 | 1.3 | 45 |
| 0:24 | 175 | 139 | 1.5 | 43 |
| 0:29 | 195 | 148 | 1.3 | 42 |
| 0:34 | 215 | 157 | 3.5 | 40 |
| 0:40 | 225 | 158 | 4.5 | 38 |
| 0:46 | 235 | 163 | 4.5 | 35 |
| 0:52 | 240 | 168 | 5.8 | 31 |
| 0:58 | 235 | 169 | 6.5 | 35 |
| 1:04 | 225 | 169 | 6.4 | 36 |
| 1:10 | 215 | 167 | 5.6 | 36 |
| 1:28 | 145 | 147 | 2.0 | 42 |
| 1:45 | 145 | 138 | 1.4 | 41 |