If you’re using a bike computer such as Garmin, Wahoo, etc. what do you display on your dashboard, and how do you set up your pages?
I use a Wahoo Elemnt and like to set it up with the following information on the main page:
Elapsed time
current heart rate
cadence
power (3s average)
normalized power
In addition, I have a second page set up based on the bike I’m using. That first one (above) is for my road and singlespeed MTB, both of which have power meters. For my geared MTB, I set up a new page that has:
Elapsed time
current heart rate
cadence (I use a simple Wahoo cadence meter on the crankarm)
VAM (Vertically Ascended Meters)
Distance
How do you set yours up? Any other ideas for metrics that you find helpful?
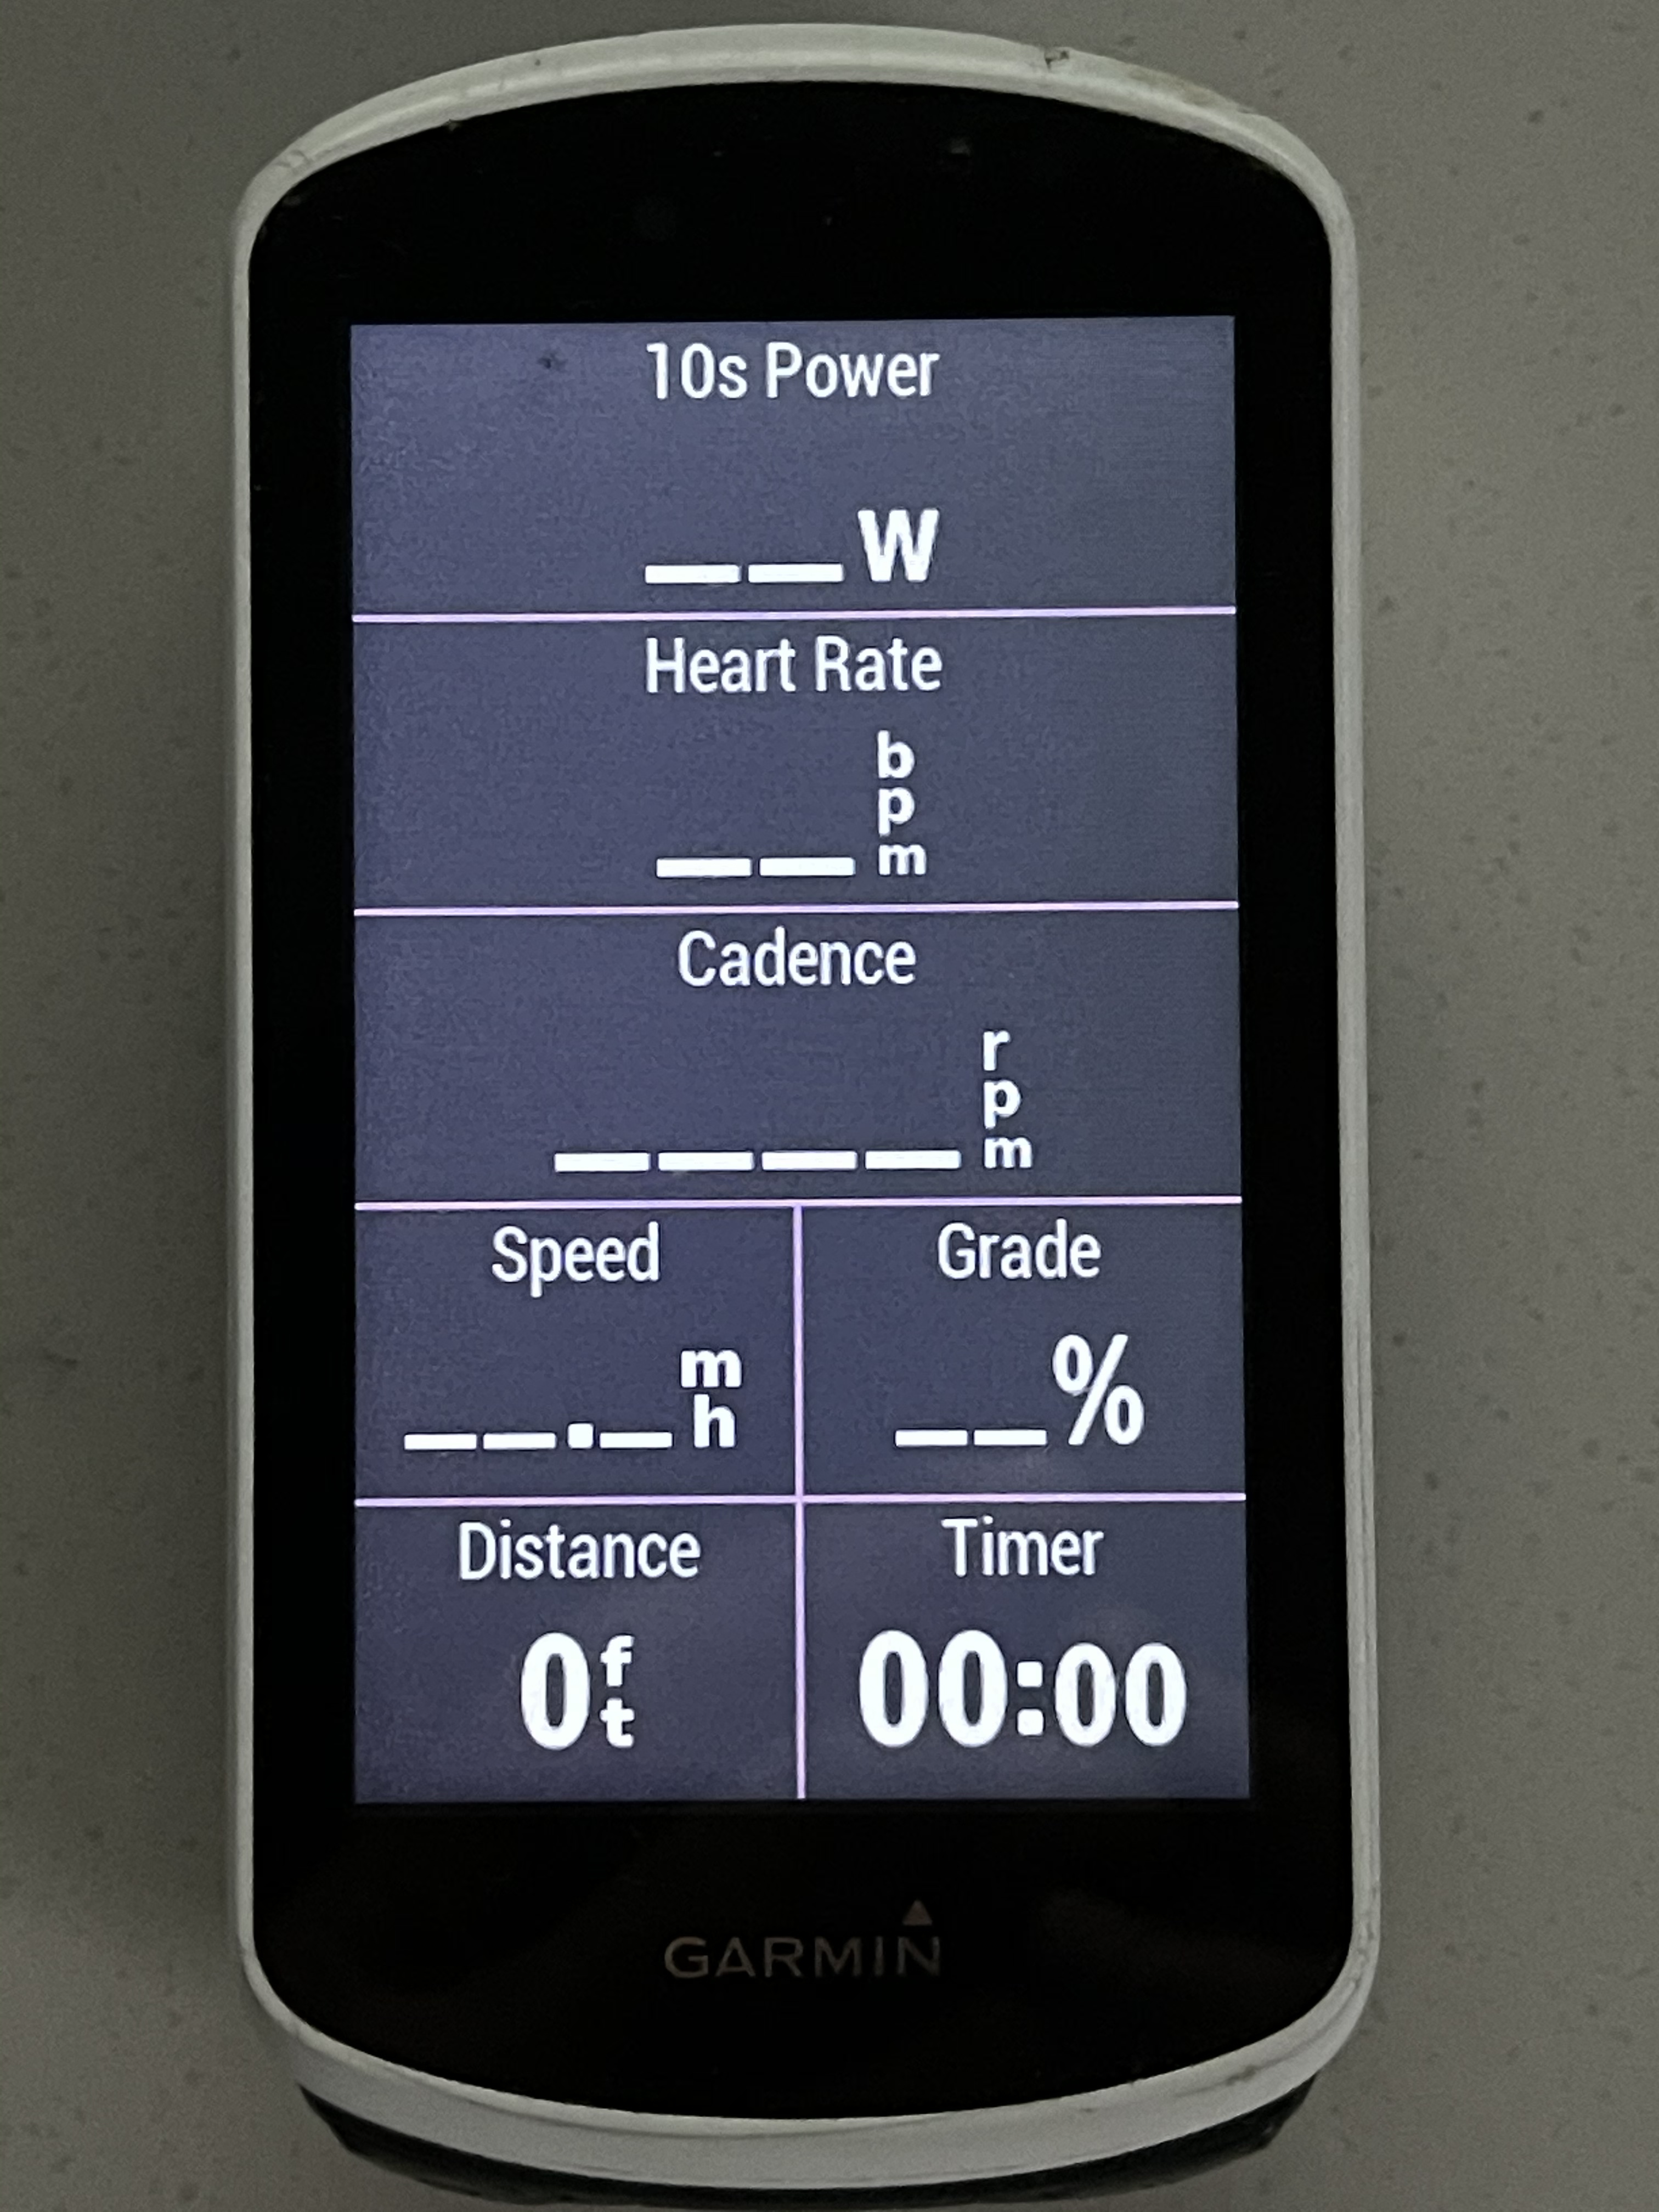
On my Garmin 530 in the mtb profile my main page has:
Heart rate with colours to show zone - keep in the blue and therefore below LT1 for endurance rides
Timer to show length of ride
XERT field MPA and Power (7 sec). Good for when I’m doing intervals to see MPA being drawn down and hopefully below my target power indicating a breakthrough and an increase in fitness
power (10 sec average), maybe that says something about how smoothly I can (or can’t) apply the power.
current heart rate
If I were better at doing intervals on the road I have another screen with:
interval time
average interval power
current heart rate.
In reality, I let nature determine my interval lengths and try to keep the power in the zone I’m “attempting” to target. I suppose I still ride rather organically (RPE) with input from HR and power. I’ve only had a power meter for about 6 months so still learning how to play with my new toy.
All of the other screens have a variety of other data and metrics that I might scroll through out of curiosity while I’m recovering or determining when I need to get home for the rest of my life. Cycling is my exercise, mental therapy, and break from real life!
I like the HR zone colors as a great way to know where you’re sitting at any given time. My Wahoo has a similar color scheme for HR or power zones and it does make it easy at a quick glance. The main screen of having power and HR is great - I love that simplicity. Really tunes you into your perception of effort.
I found it interesting that we all, so far, have different power smoothing (3sec, 7sec, and 10sec) set on our devices. As Jeffrey said, we can certainly see how smoothly we are applying power and mask some of the pedaling inconsistency with higher smoothing factors. Of course, for short high-intensity efforts we might not get the feedback right away, but if we have a good feel for the effort (based on RPE), we can still achieve excellent results.
If I need to pay attention to the ride, I have these screens that I can increase/decrease how many are displayed on my Wahoo… There’s a lot, but rarely have them all active. I find it’s nice to have the last couple (dist, climbing) for live summary.
Ride Time
Heart Rate
Cadence
3s Power
Speed
Avg HR
Avg Power
Norm Power
Distance
Elevation gained
Interval workout and “Strava segment” page are pretty similar, but I also include VAM because I don’t always trust my powermeter and VAM (for hills, of course) is an absolute climbing metric.
Lap Time
Heart Rate
Cadence
3s Power
Lap Power
VAM
Speed
Page 1 - Time, speed, distance. That’s the page that is on if I am racing
Page 2 - My “training page”: Time, 3 sec pwr, lap pwr, HR, lap HR, cadence, lap speed
Page 3 - rando might need to know. time of day, temp, grade %, total ascent, Ave speed, pwr zone, power %, power
Page 4 - Summary stuff. NP, IF, KJ, TSS, Max Speed, Max Power, Ave HR, Calories
Im use 7 seconds and could use 10 seconds as I ride solely on my mtb so keeping it smooth can be difficult off-road and even on the road with the added inertia of 2.4 WT tyres!
@dreednya, that’s a great point about the MTB power output. On some trails the power can definitely be all over the map, so turning that 7sec up to 10sec can be very helpful to know where you’re at. Good call!
Another Wahoo user here. I can’t remember the exact data fields but I tend to do pages of related fields for different riding styles.
So there is an interval page which has the usual interval time, power targets, cadence and cadence targets; you get the idea.
Then I have a training page that tracks overall time, TSS, workout intensity and other training metrics.
After that I have an ‘averages’ page to display the usual array of ride averages.
Finally I have a boredom page for those longer rides. This contains all the stuff that take your mind off the four hours in your legs and answer the question of just how cold is it
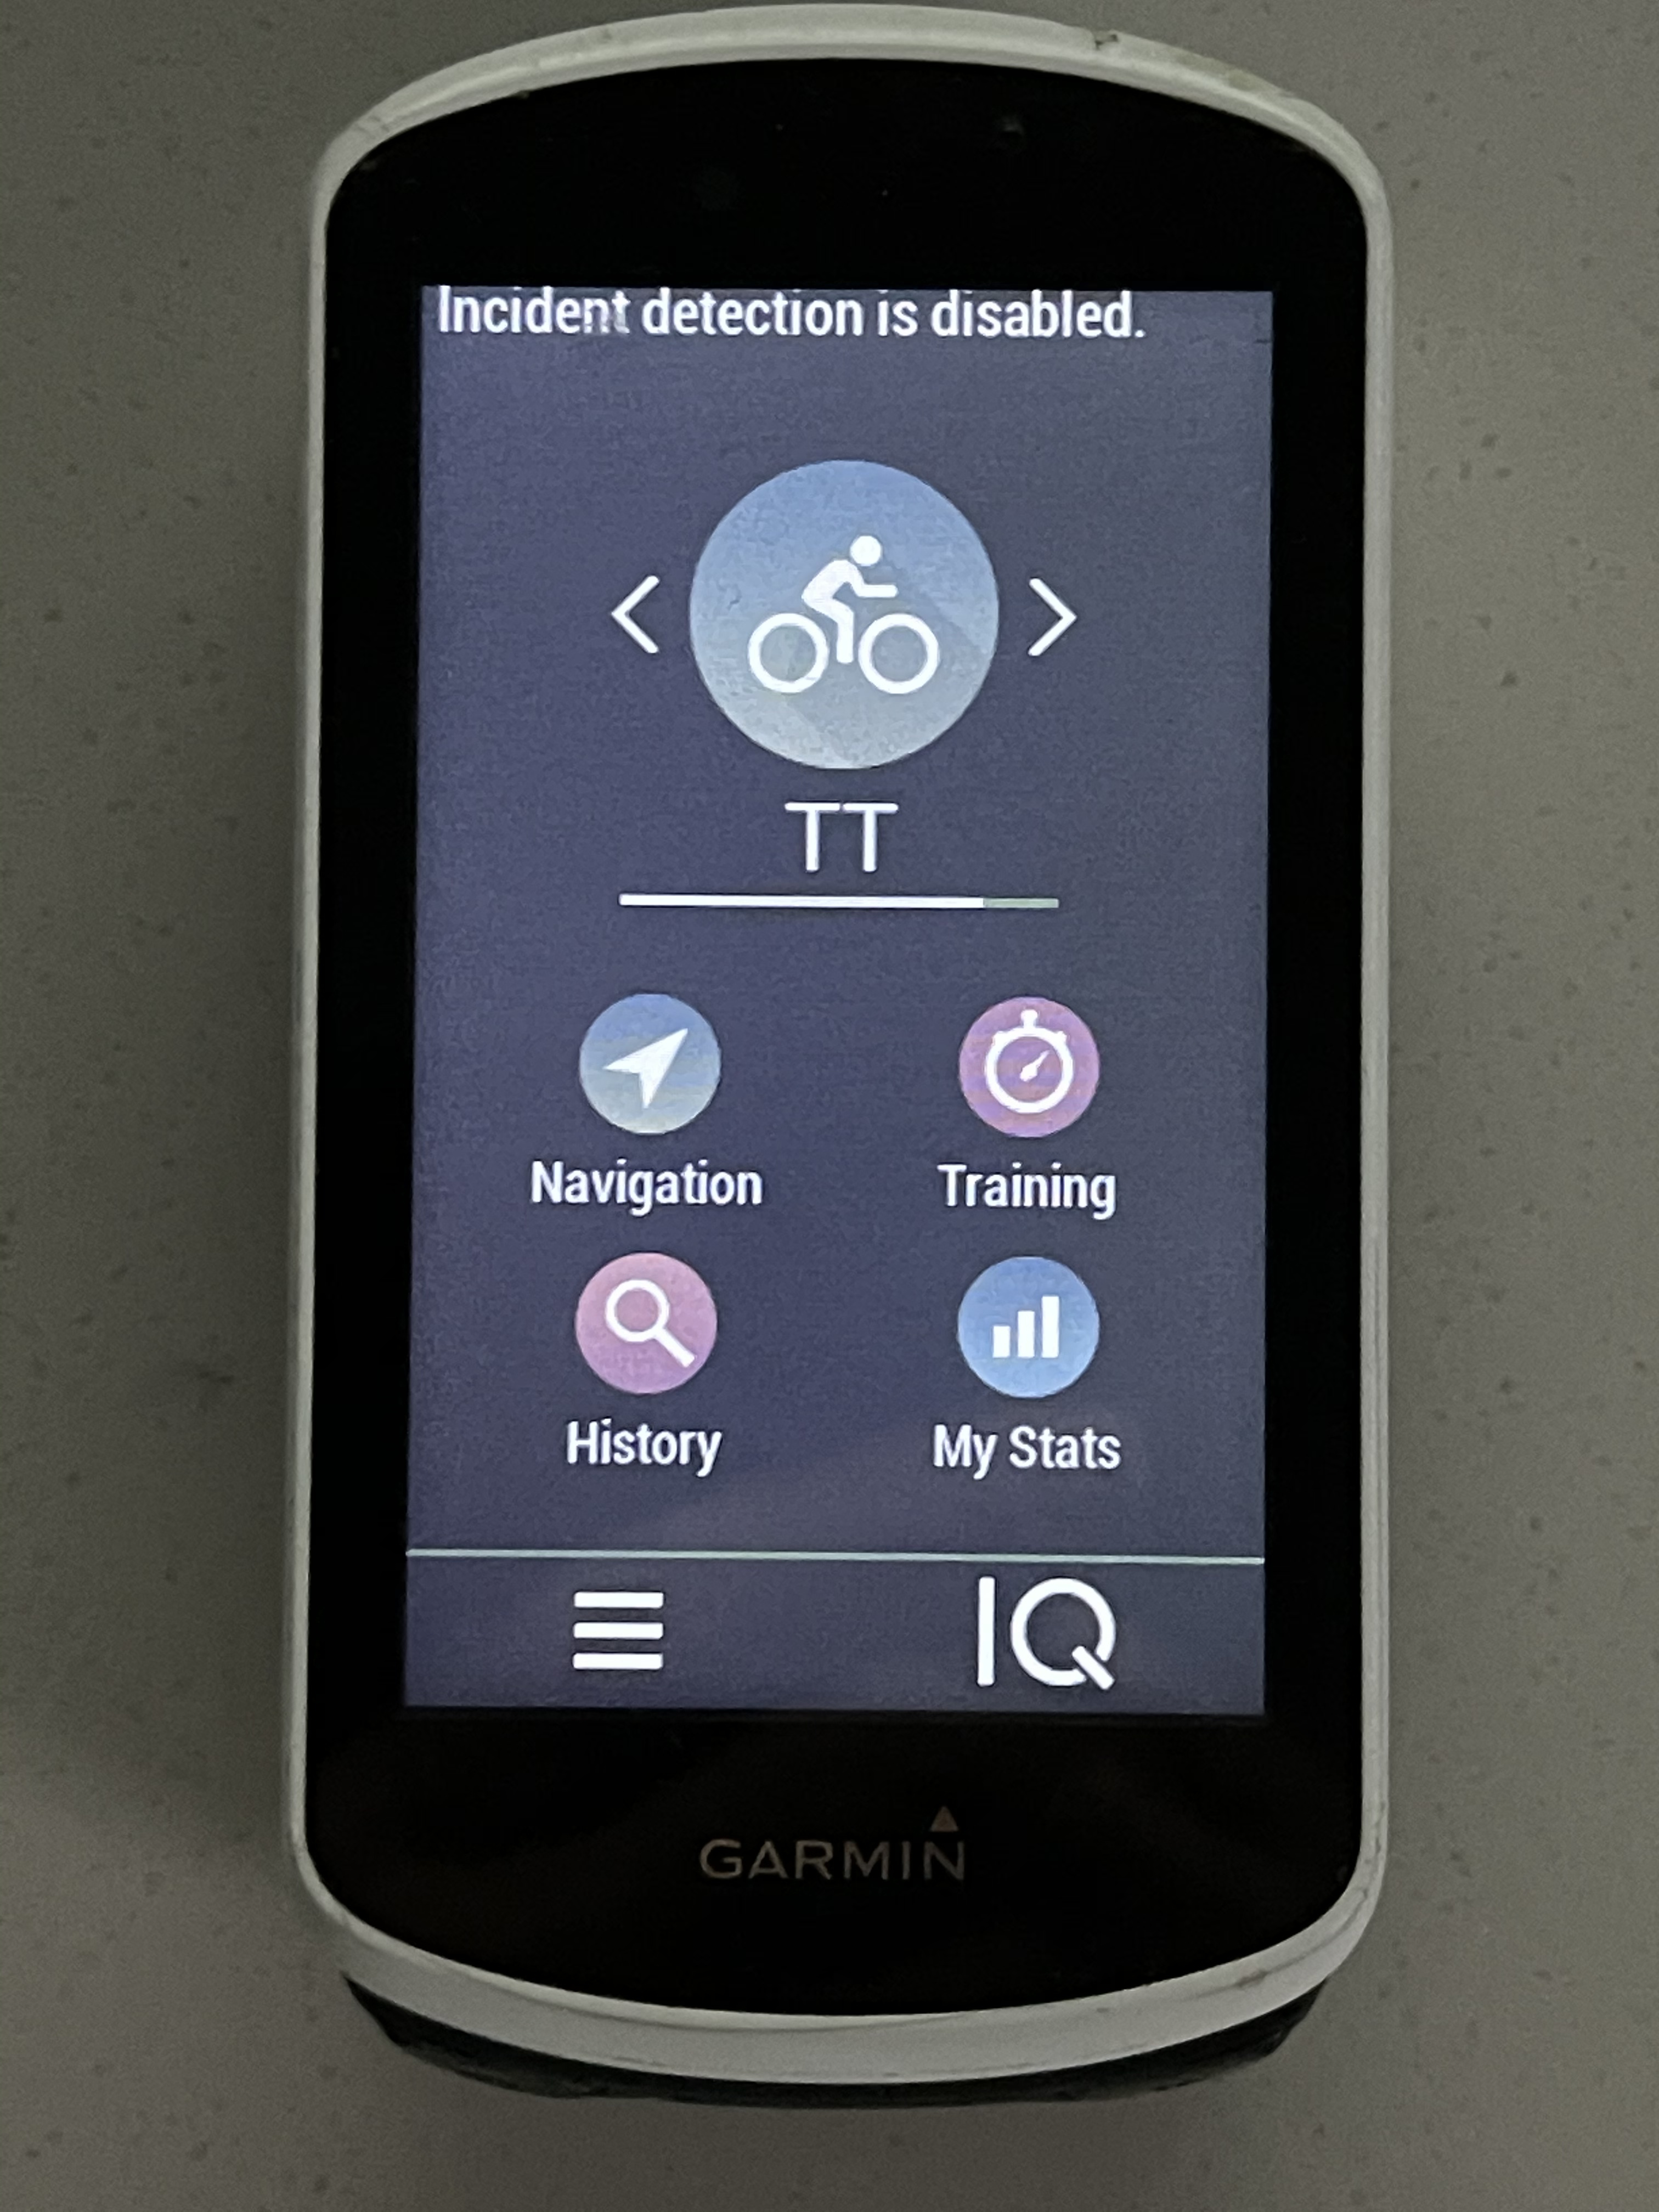
I use several different bike profiles (Road, MTB, Cross, Gravel, TT, eBike)
One tip - it takes a long time to get all this figured out. I’m sure I could copy my Garmin data to back it up if there lost/broken/malfunctioning/new device but I’m not that computer savvy. So, I take pictures of my screens. Makes setting up new device a lot faster!
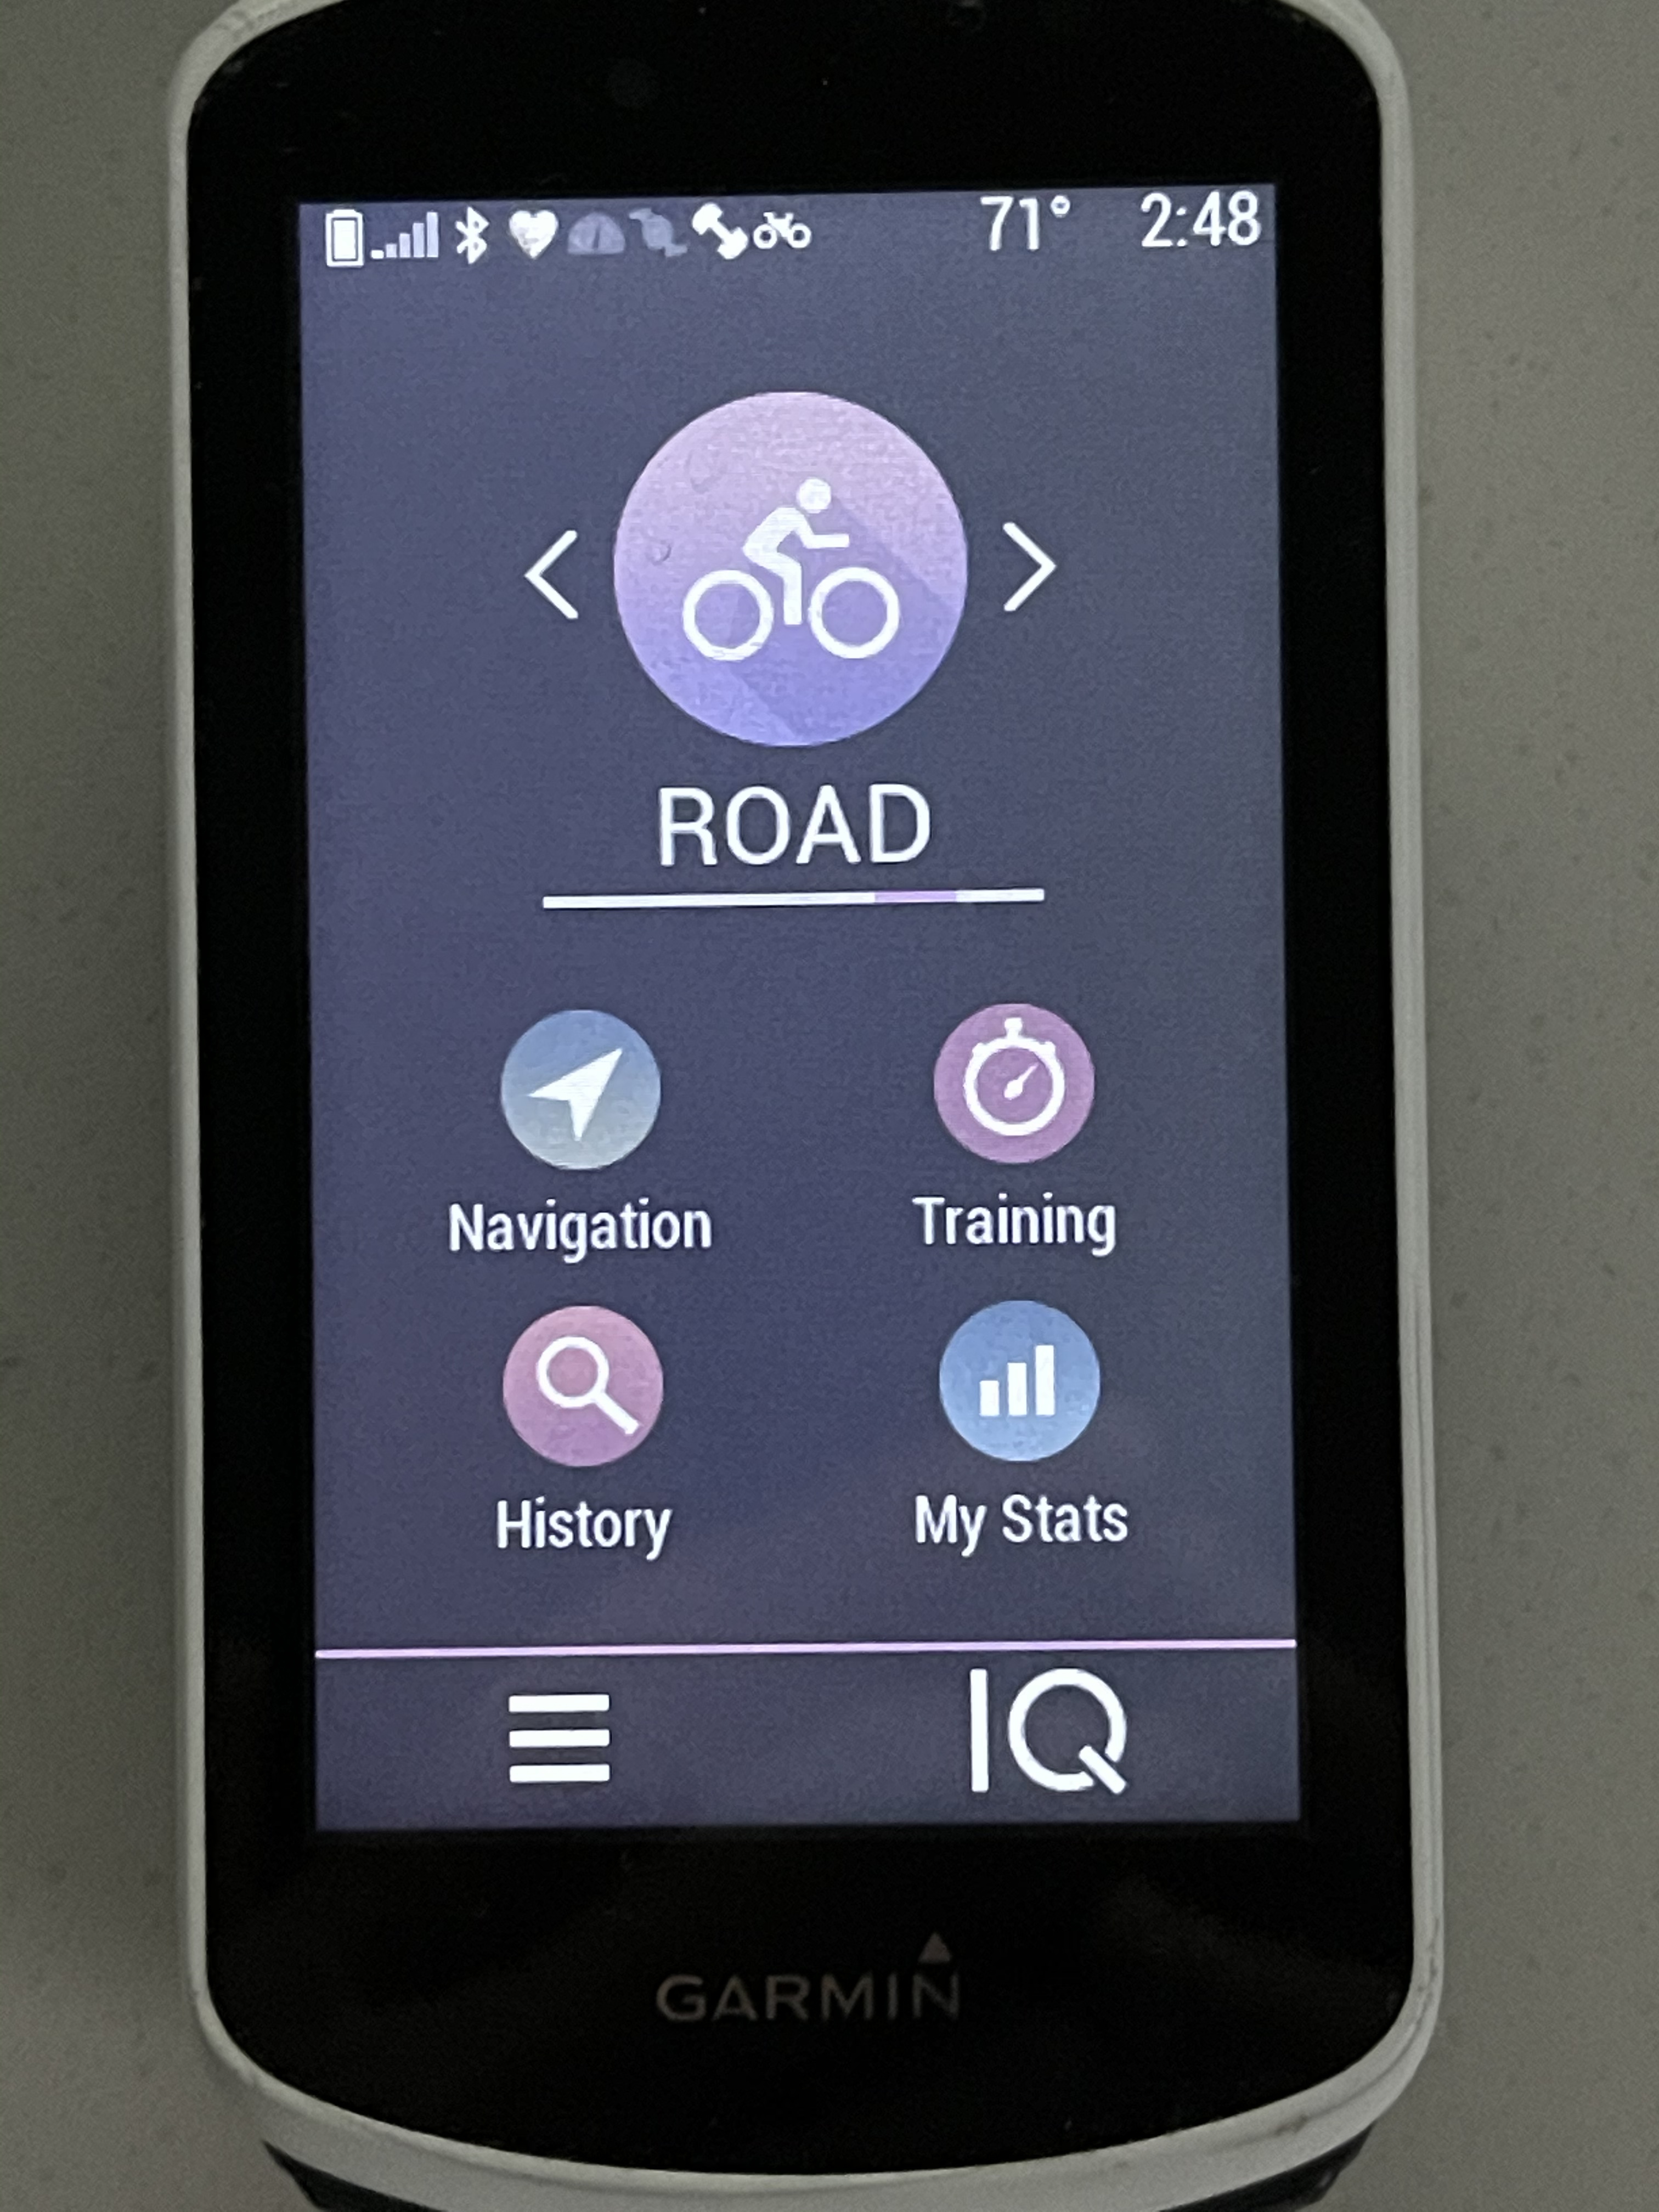
Garmin Connect IQ app “MY EDGE2”
The one screen to rule them all. Im on this screen 90%.
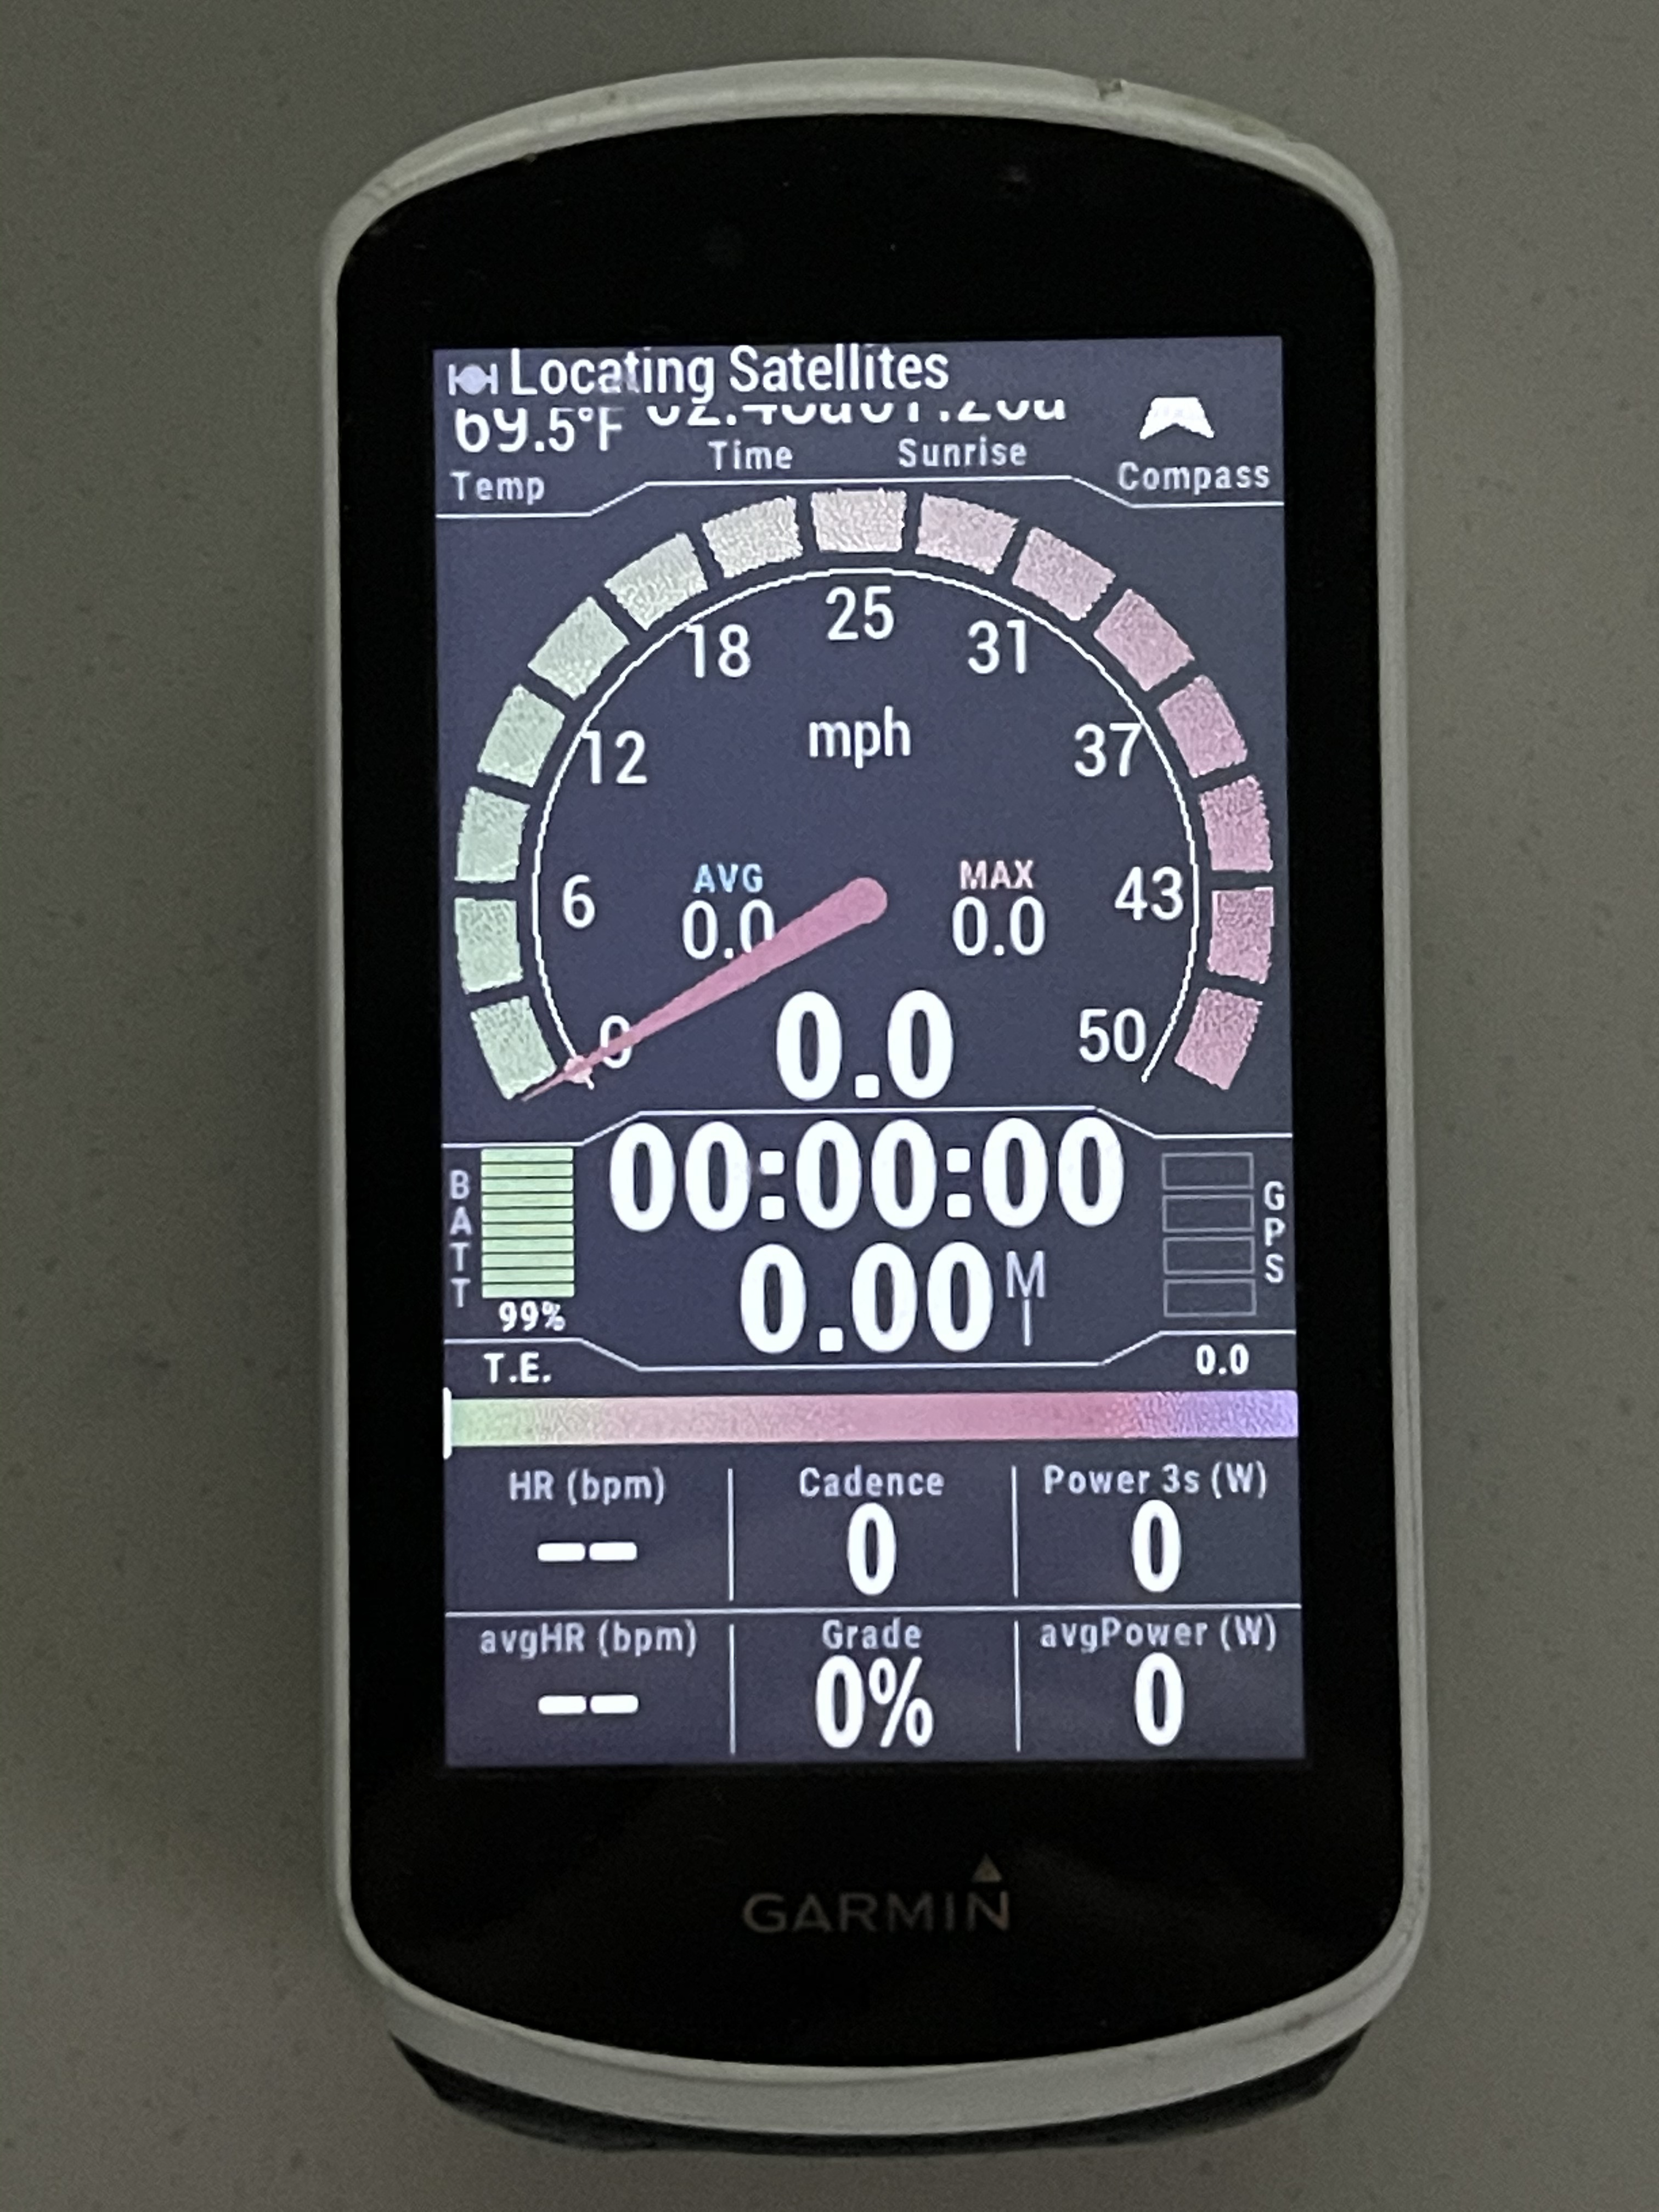
Fun analogue speedometer. Beautiful layout.
All the data you need for long ride.
Ride Time and Distance
Garmin Battery Level
Time of day/Sunset
Temp
Power, HR, Speed and Averages
Cadence and Grade
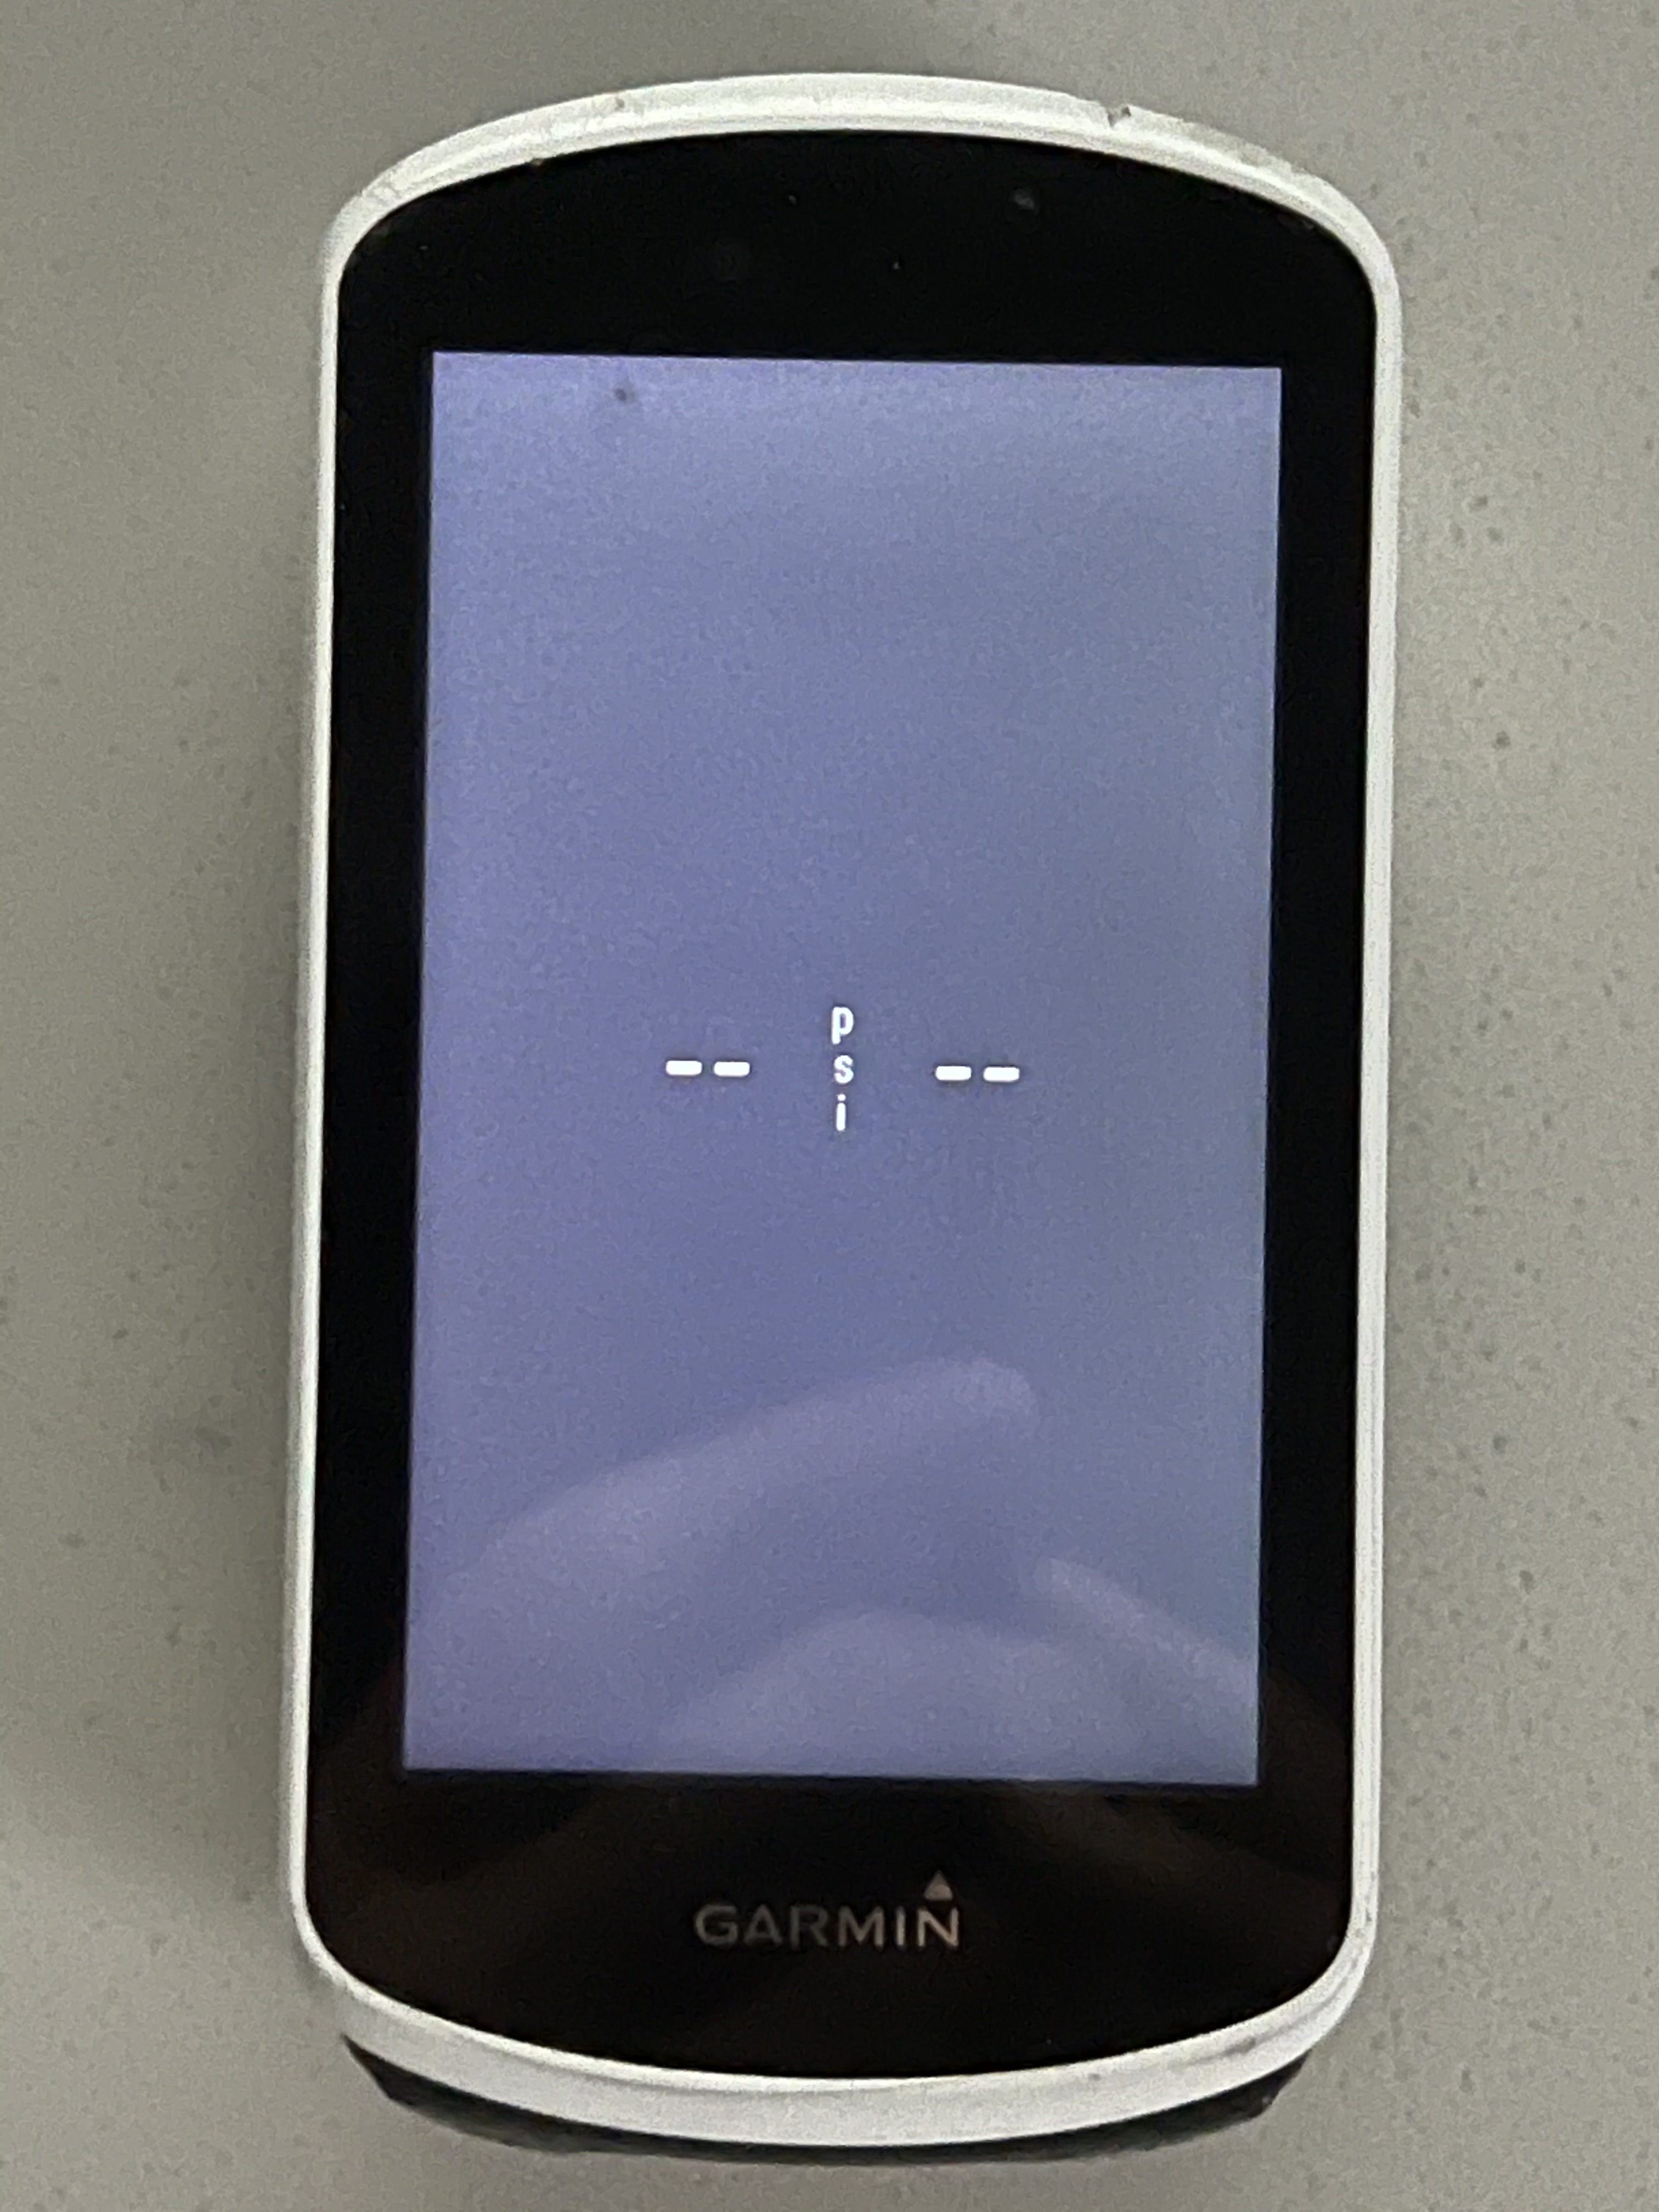
Garmin Connect IQ app “TyreWiz”
Great (especially during racing) if you are using Quarq TyreWiz pressure monitors (which I only recommend for racing btw…)
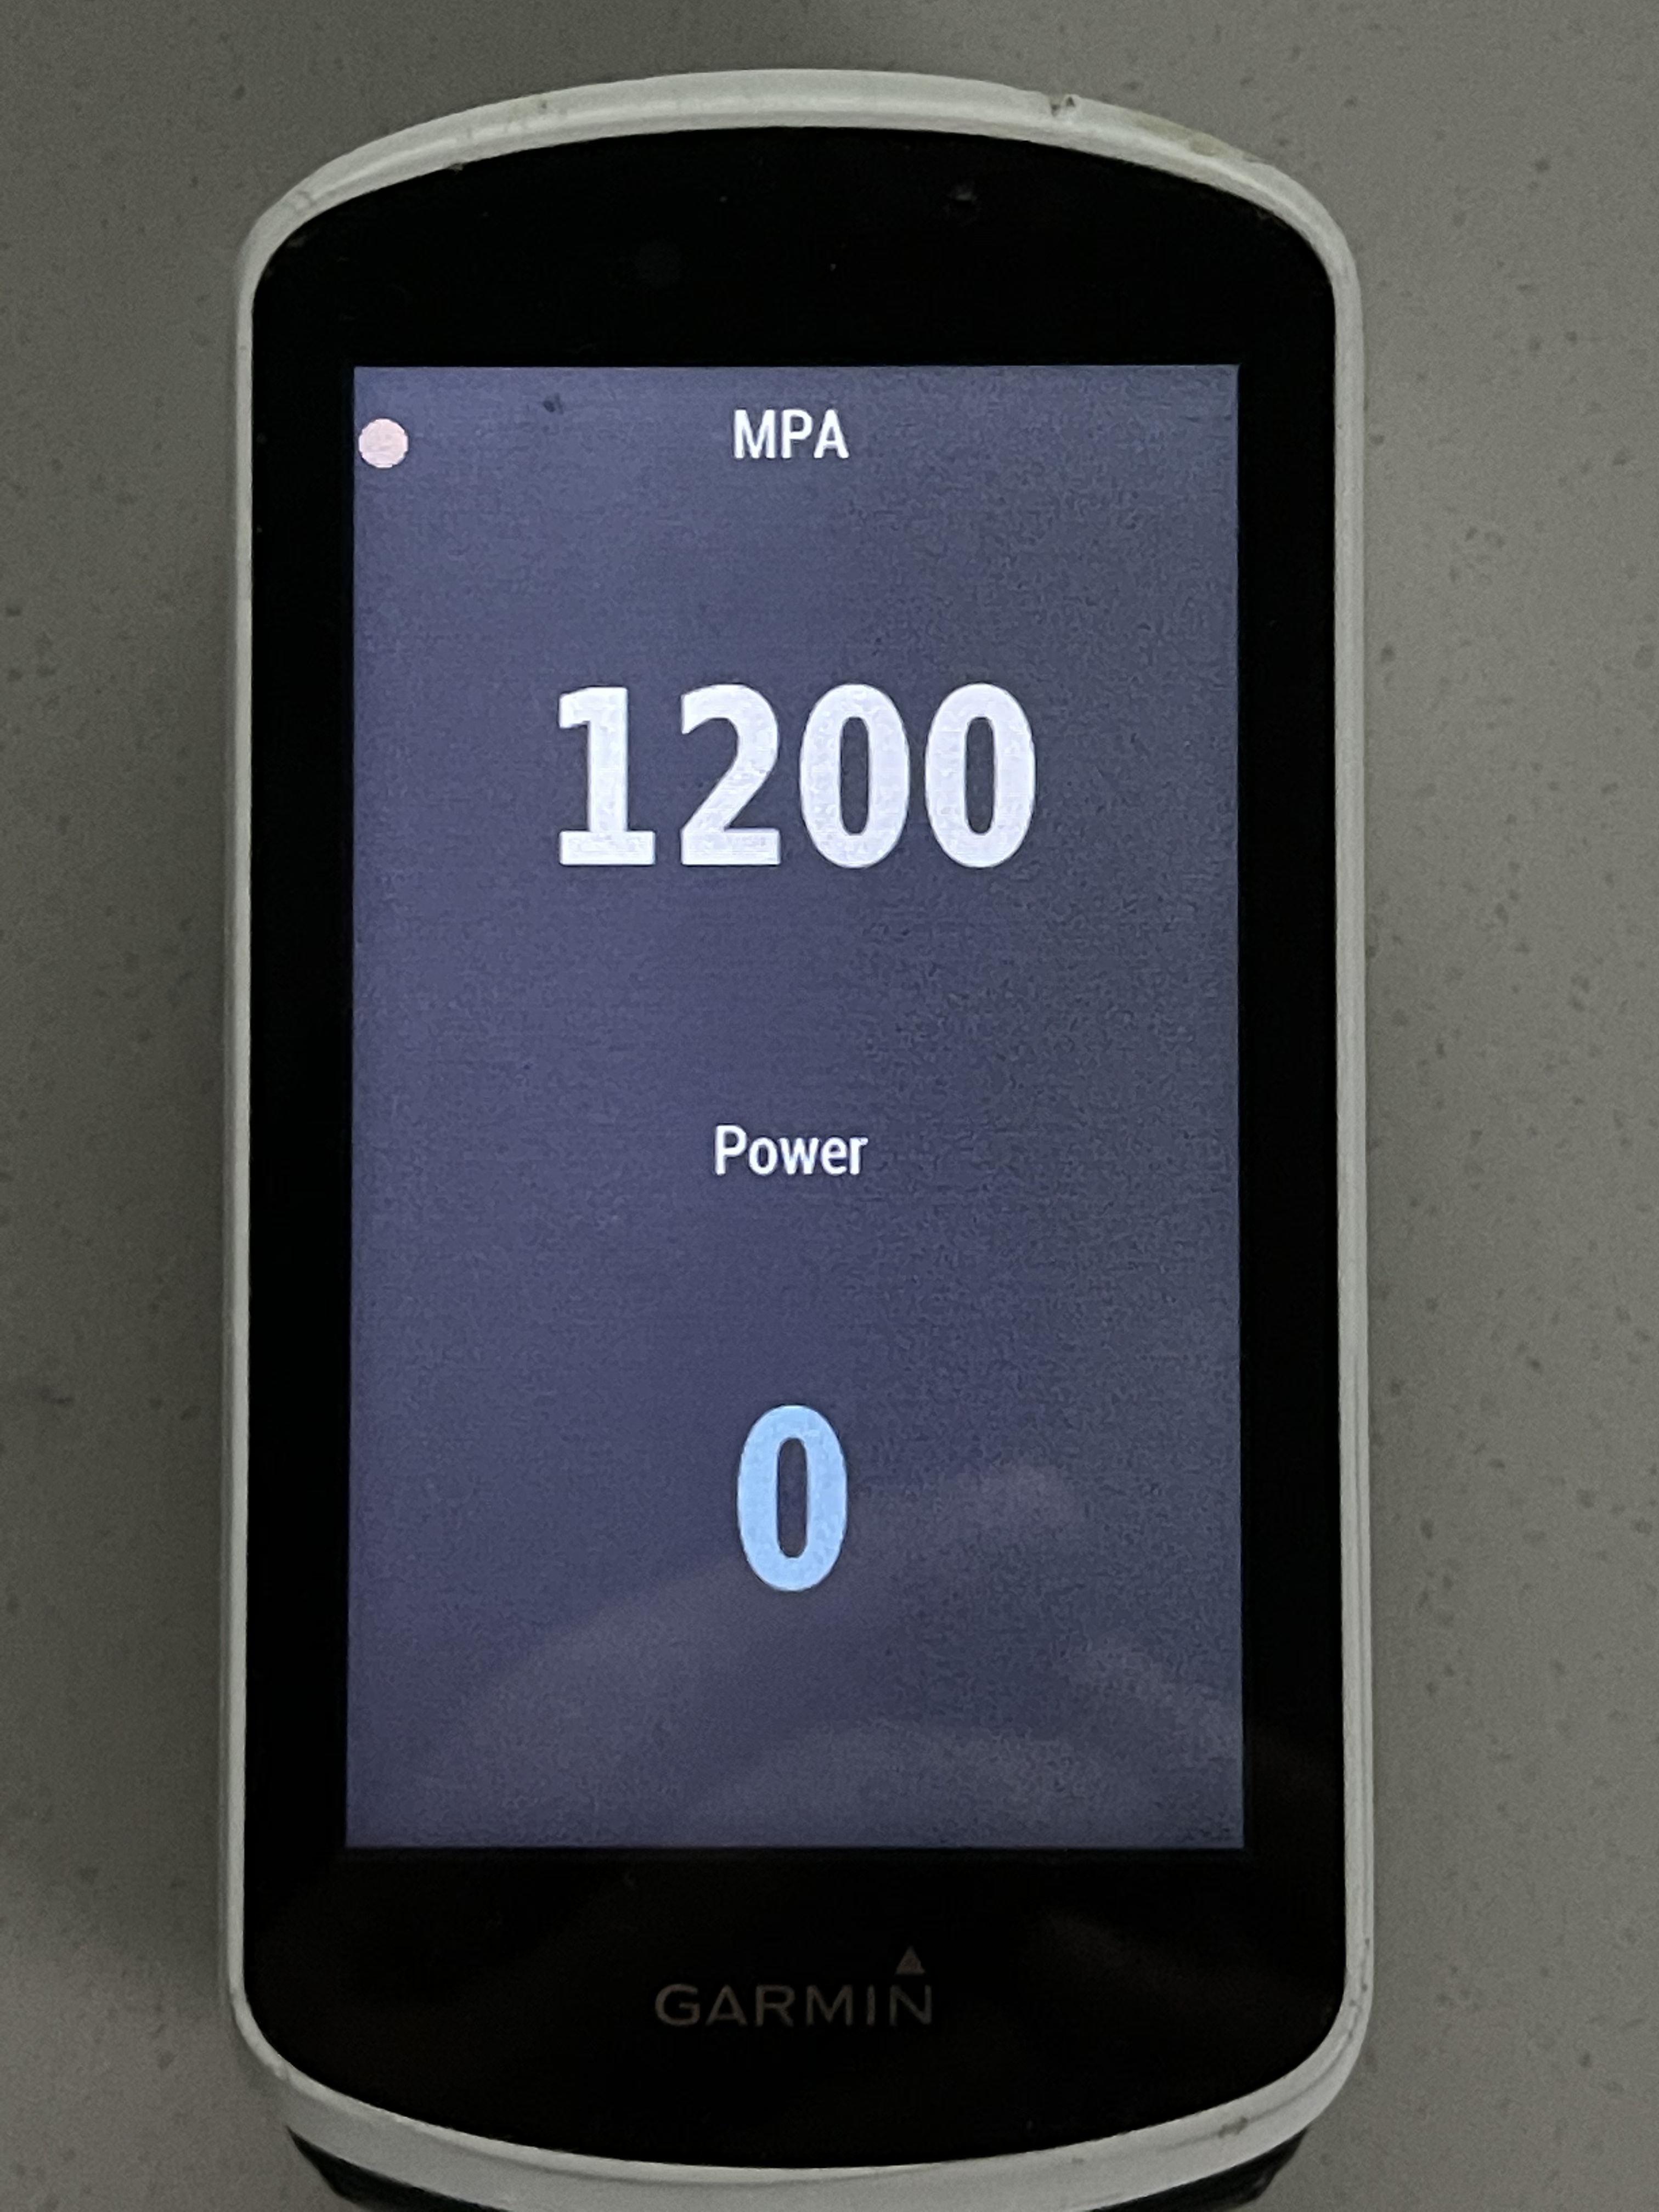
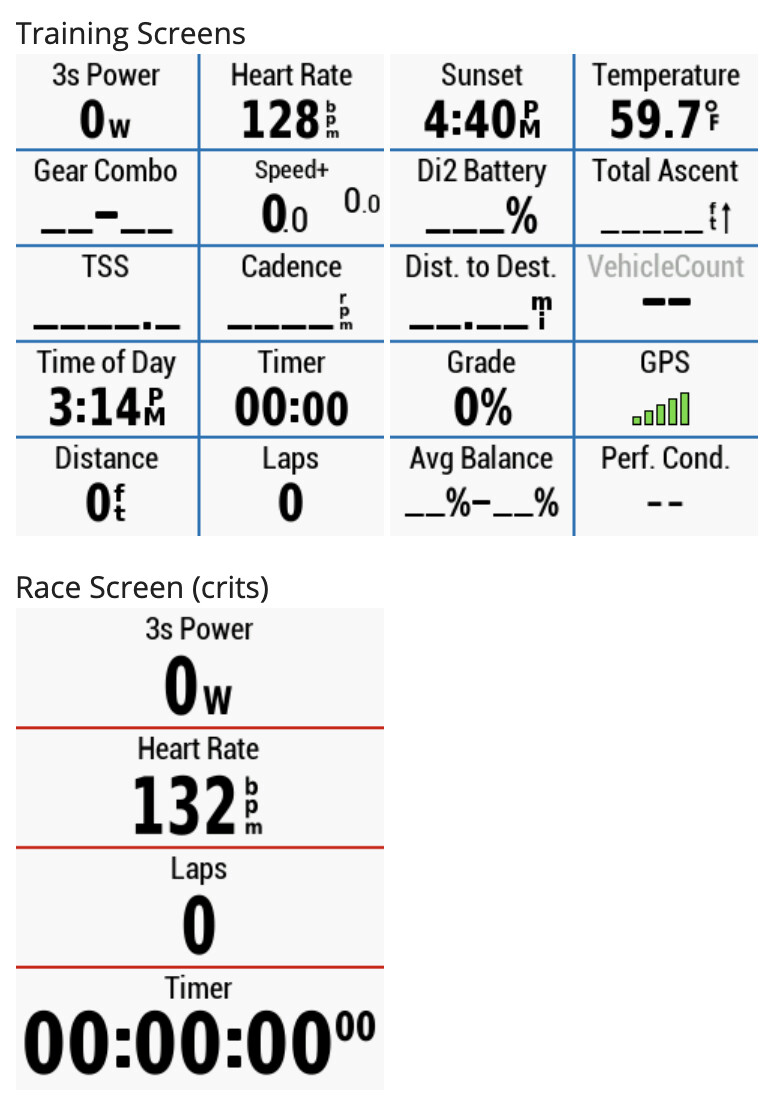
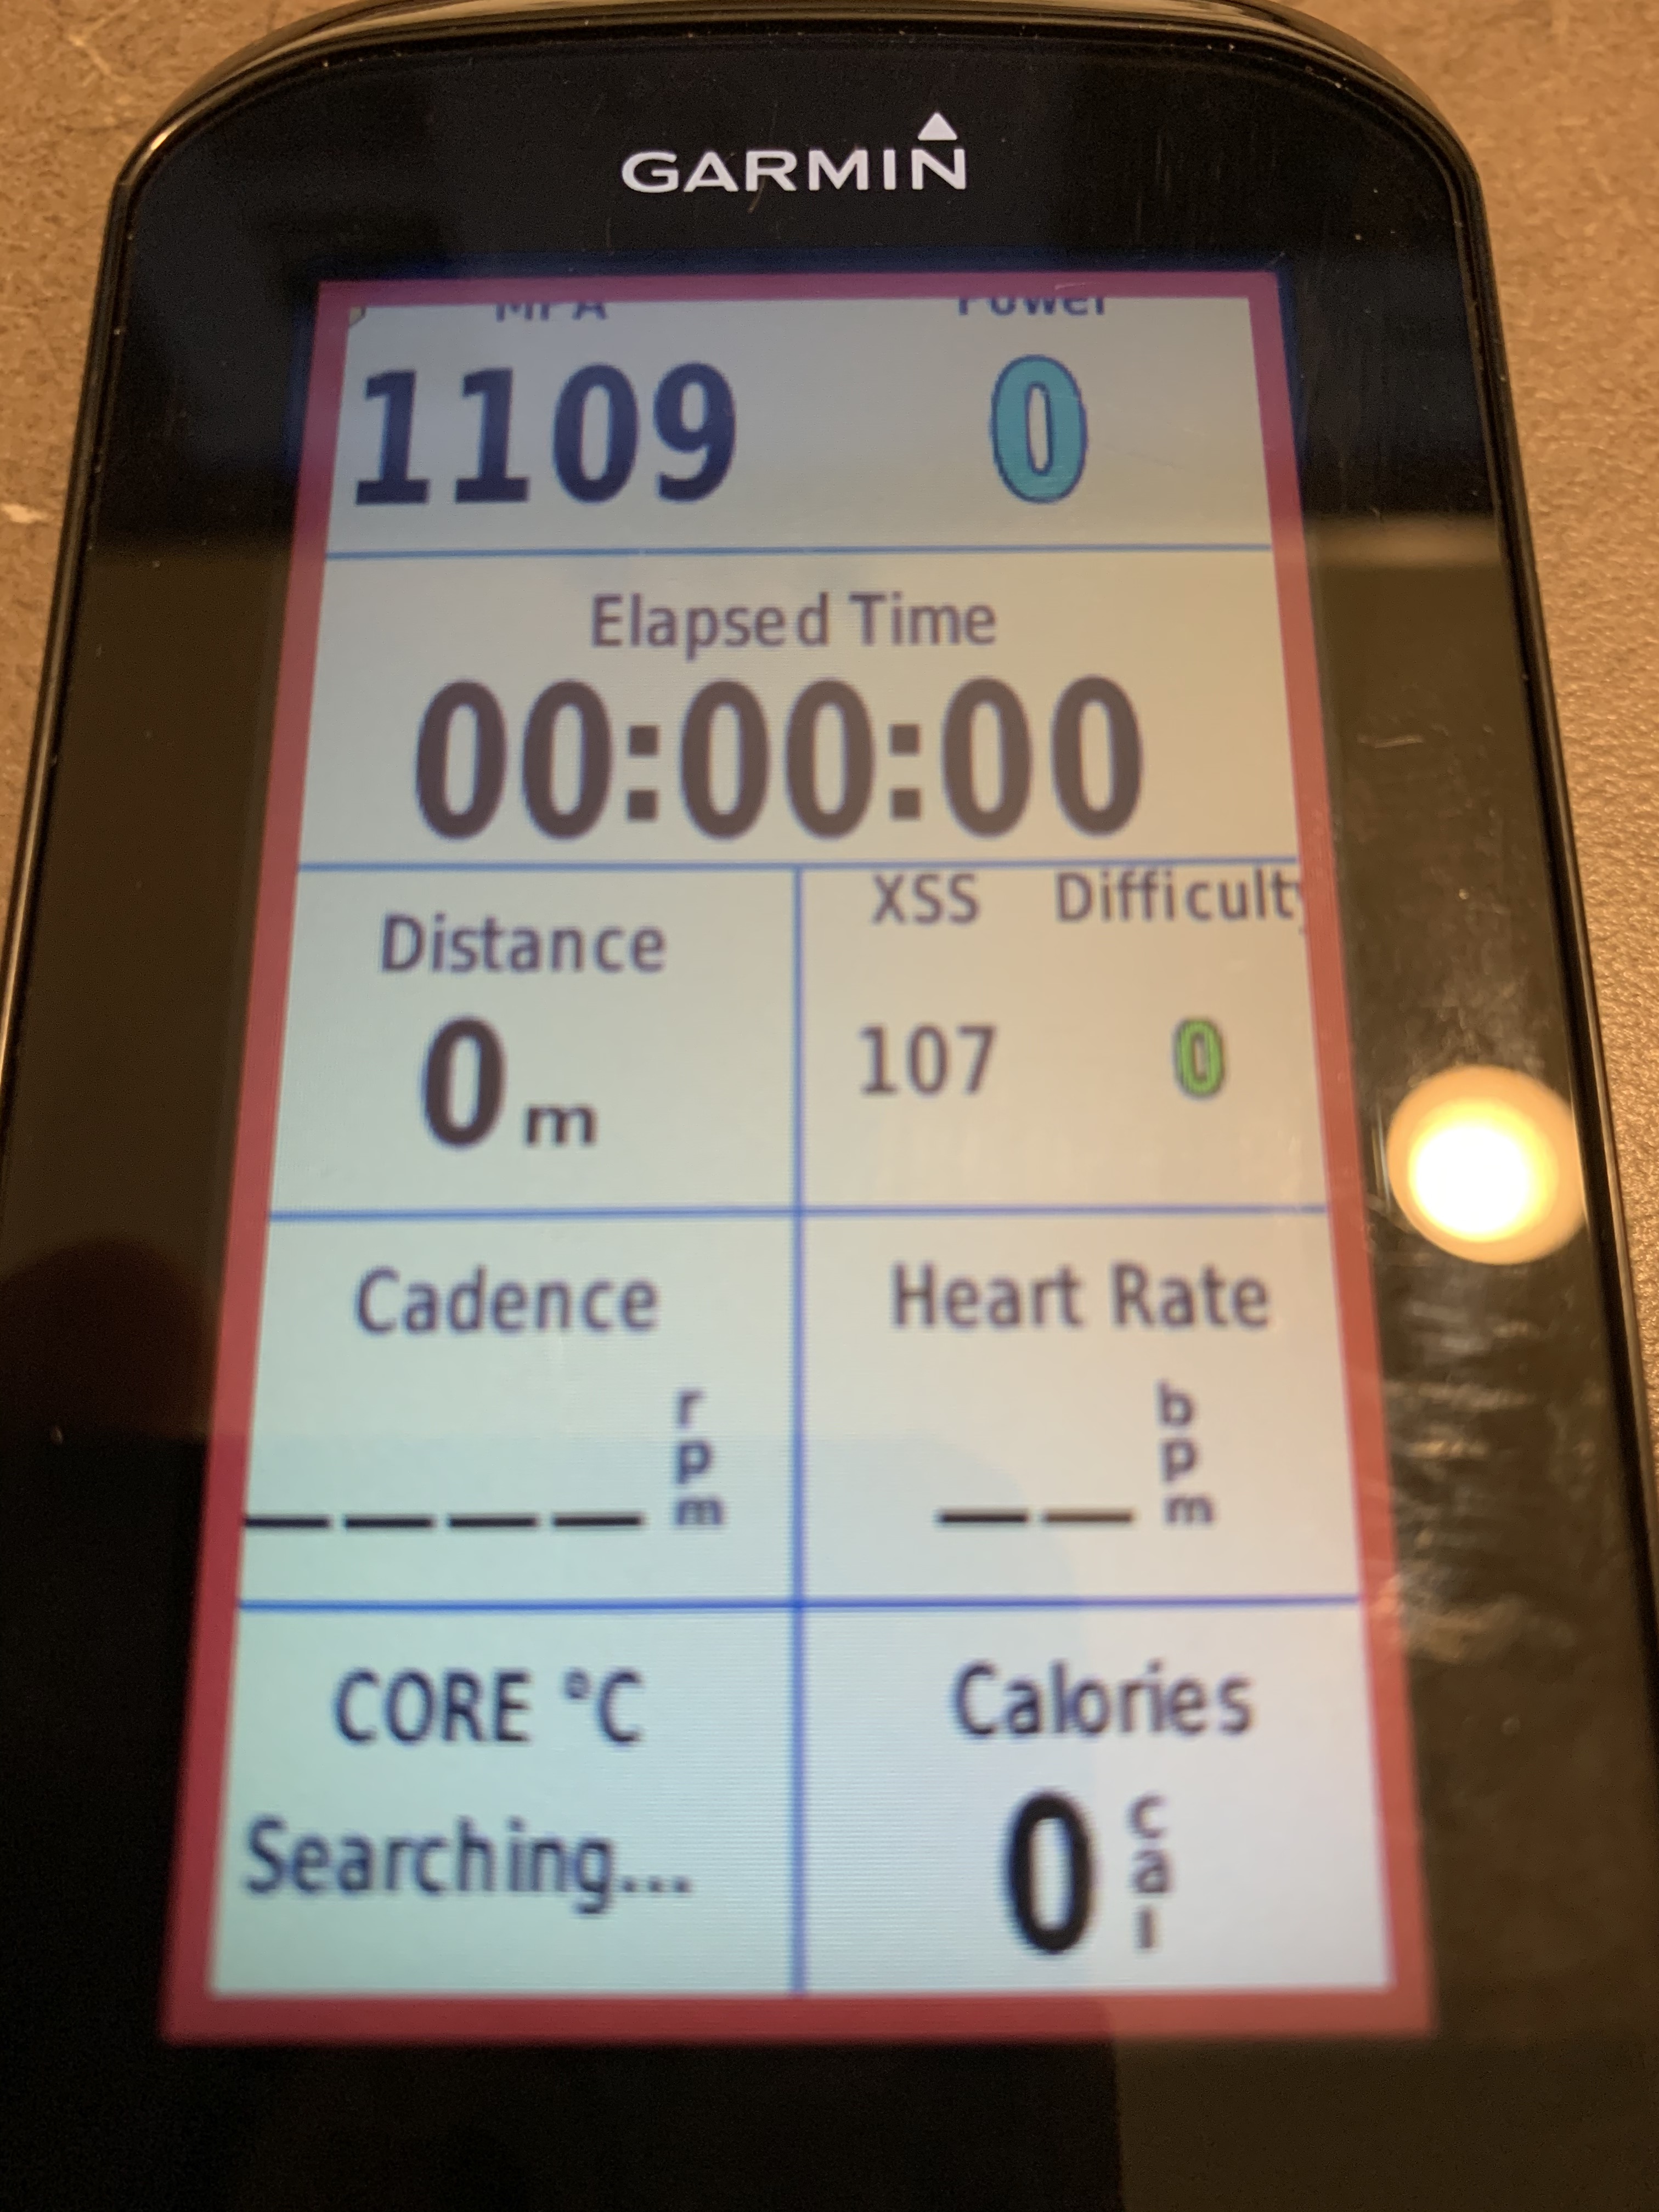
Here are the screens that I go with on my Garmin 1000. I don’t have nearly as many as @trevor, and the main Xert data fields that I use come down to MPA/Power, and XSS/DS.
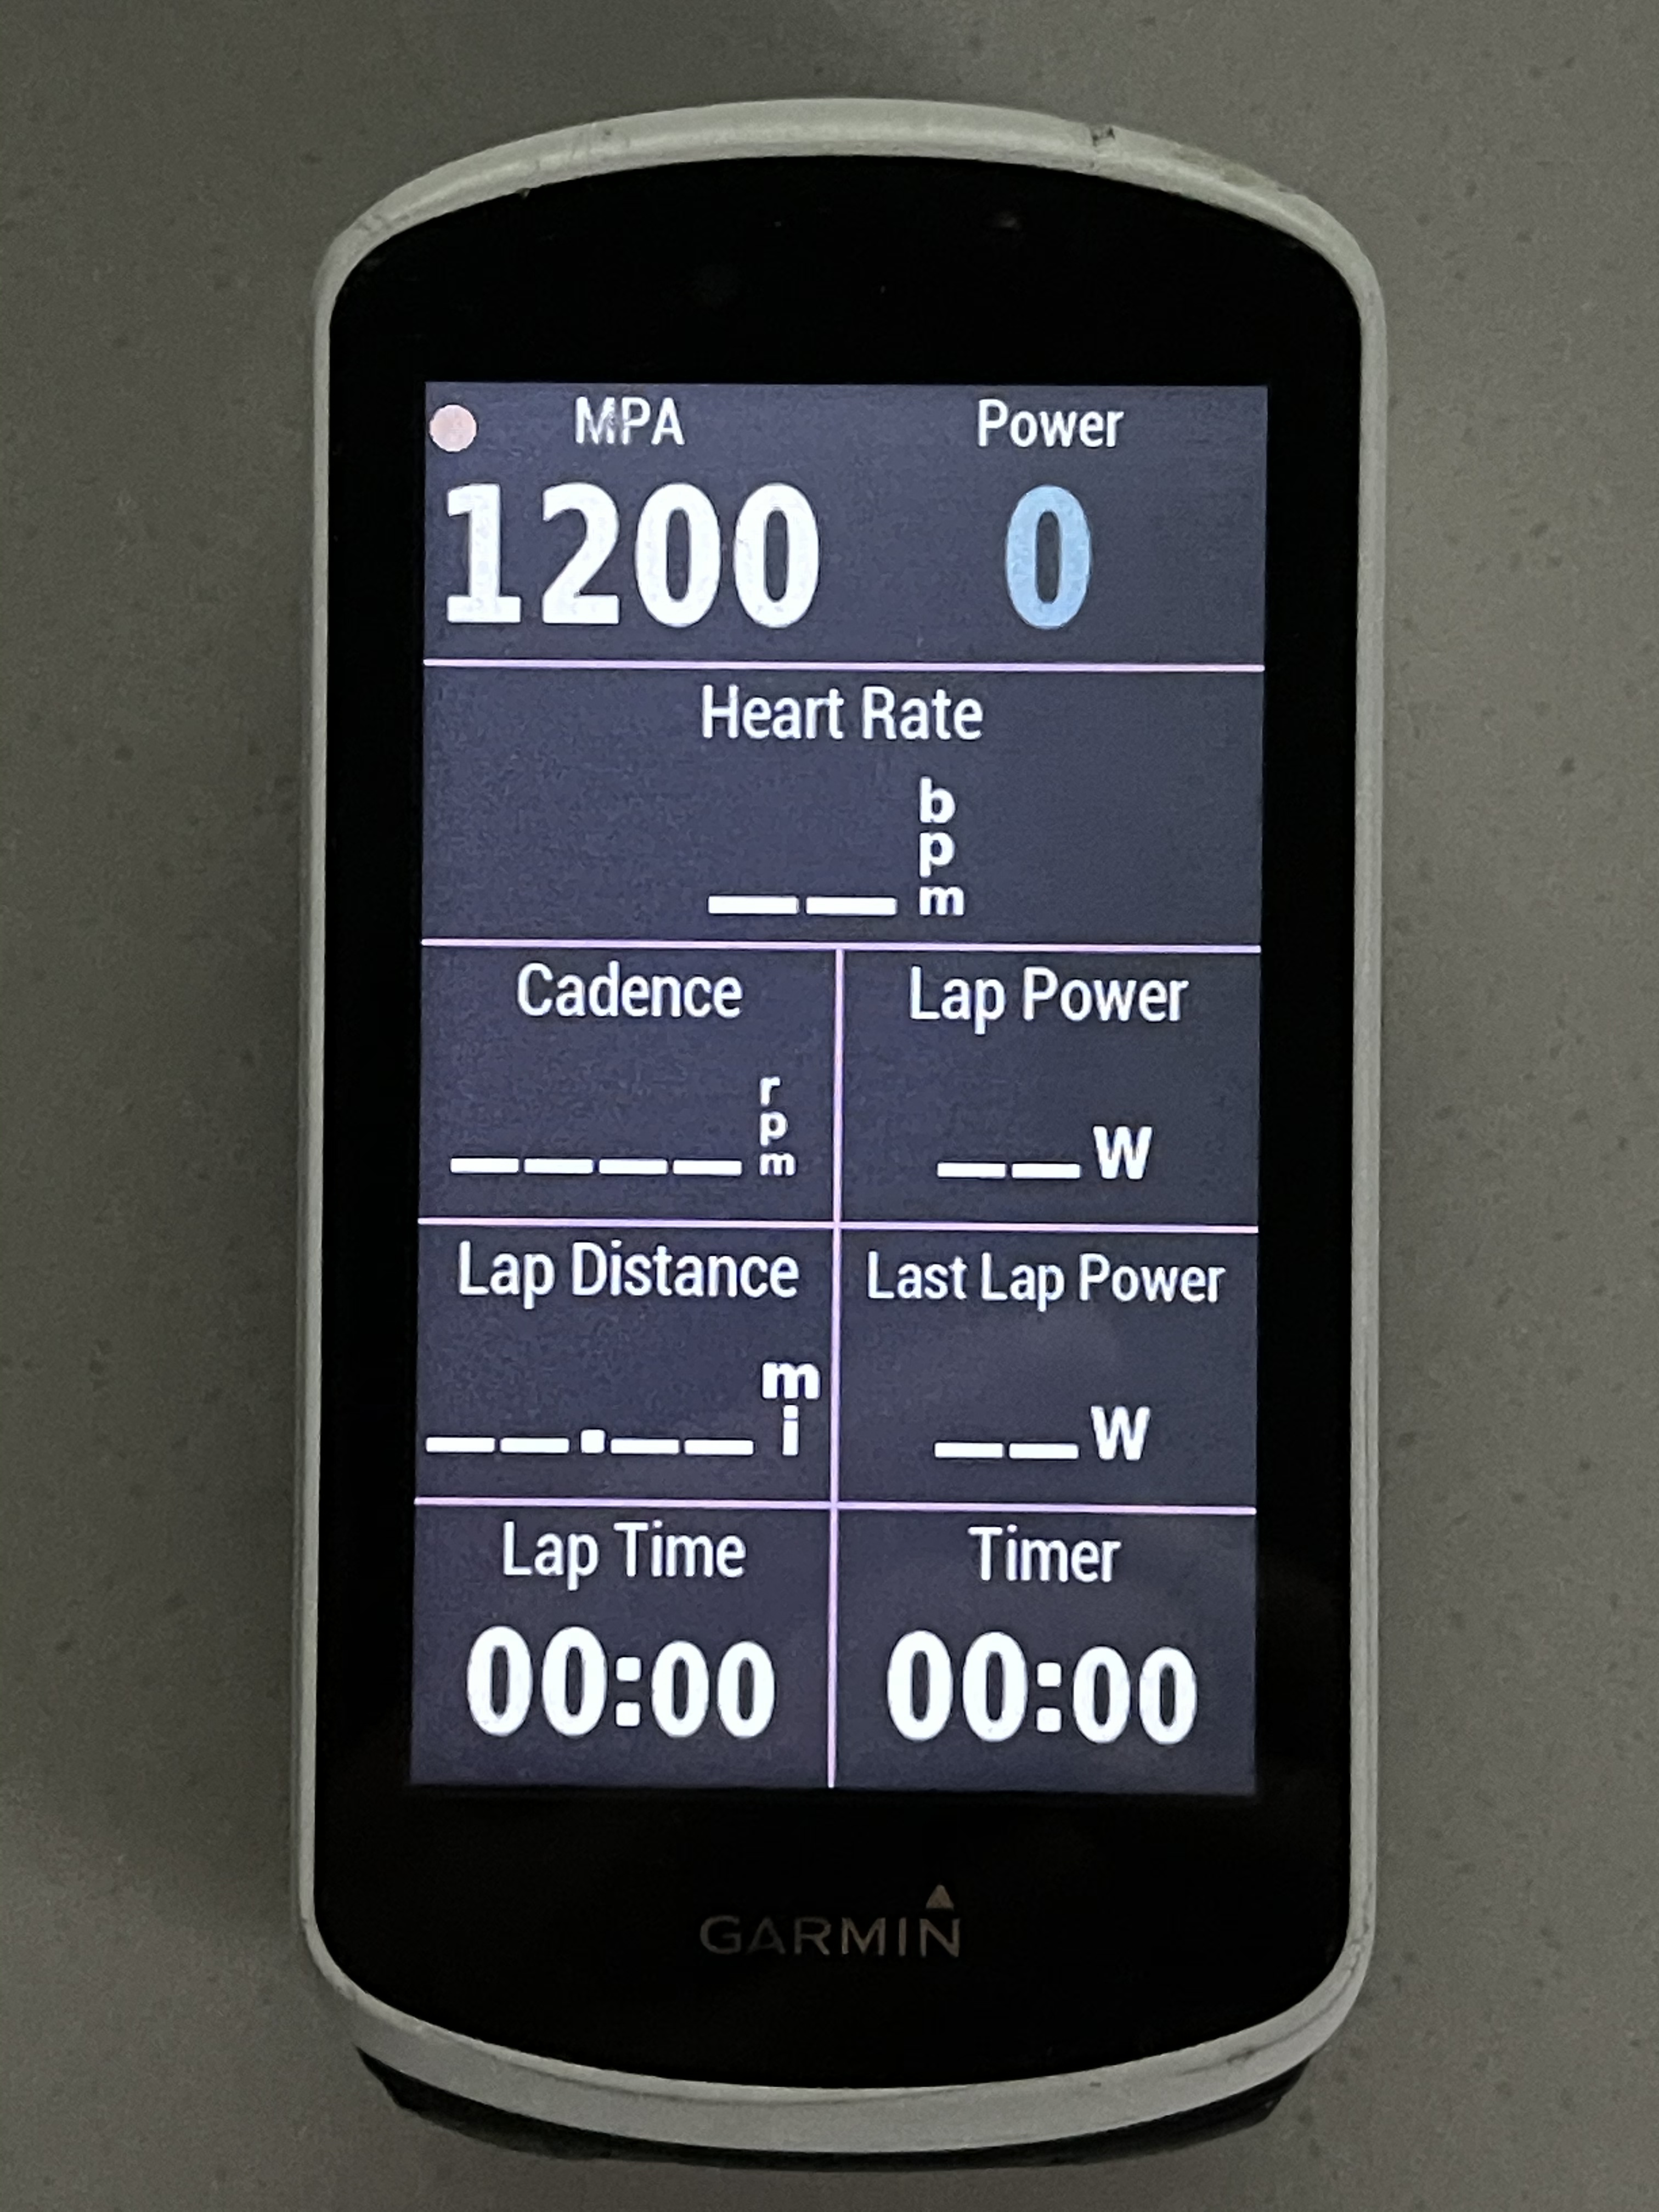
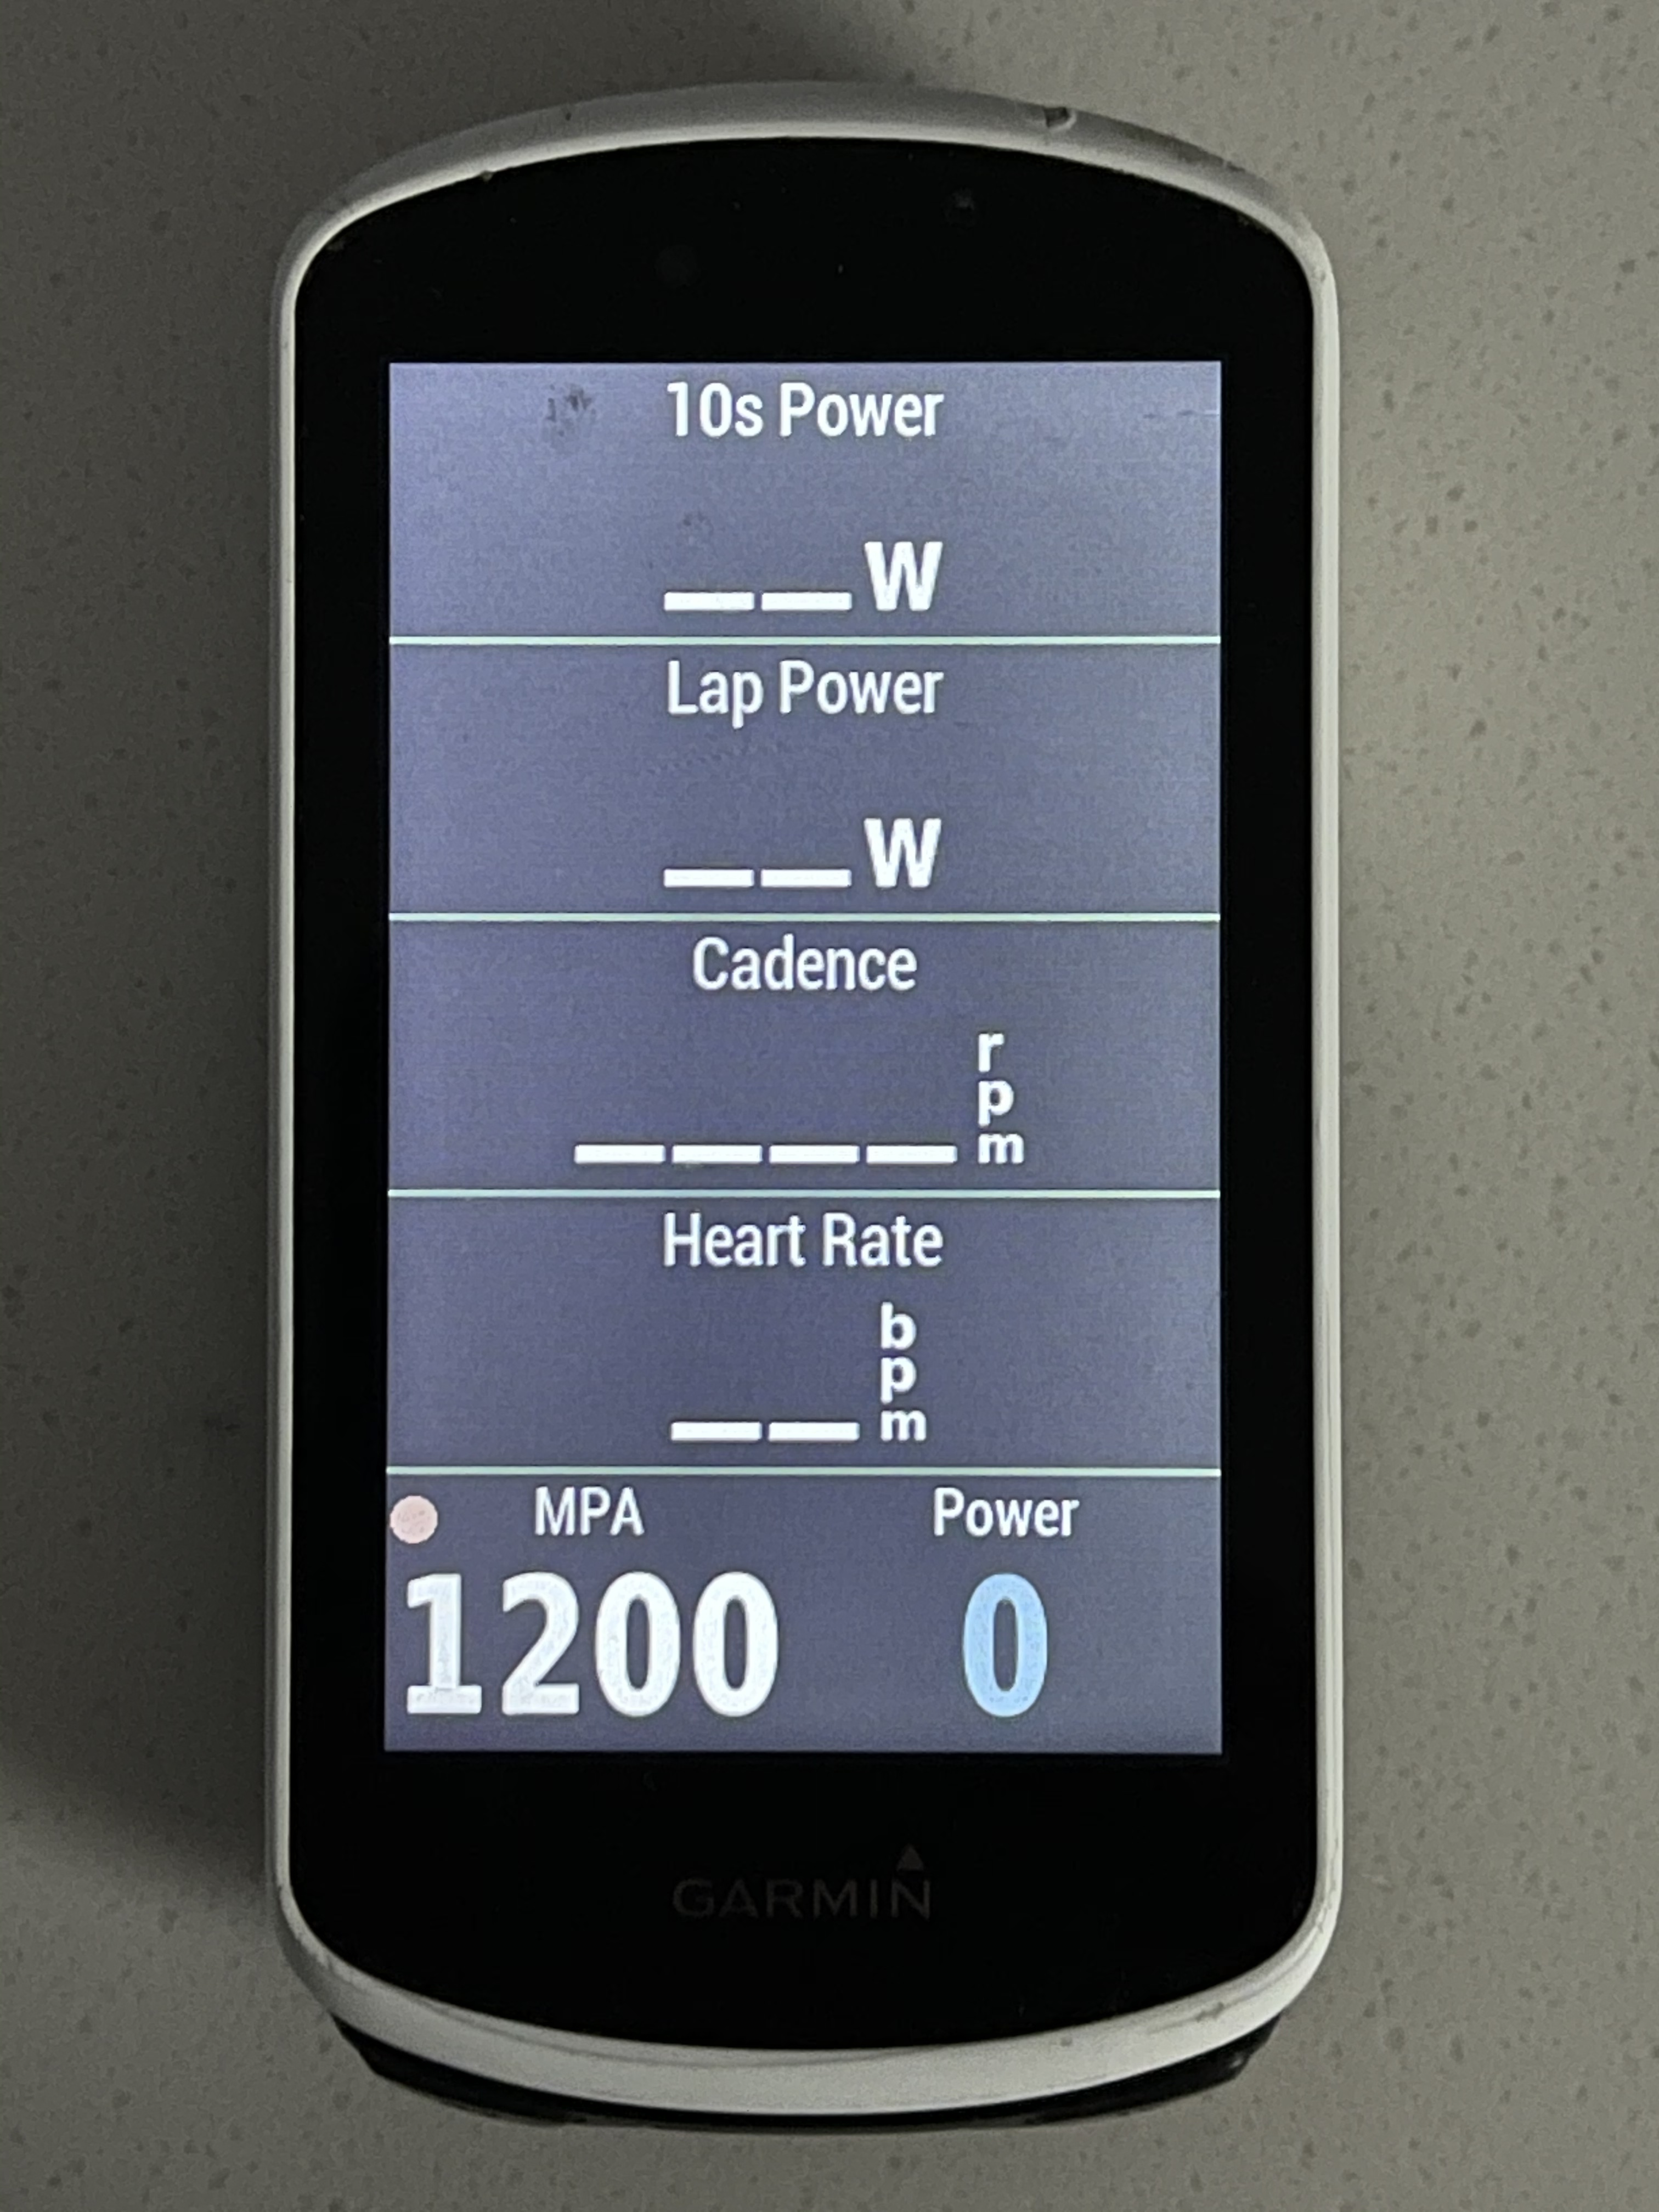
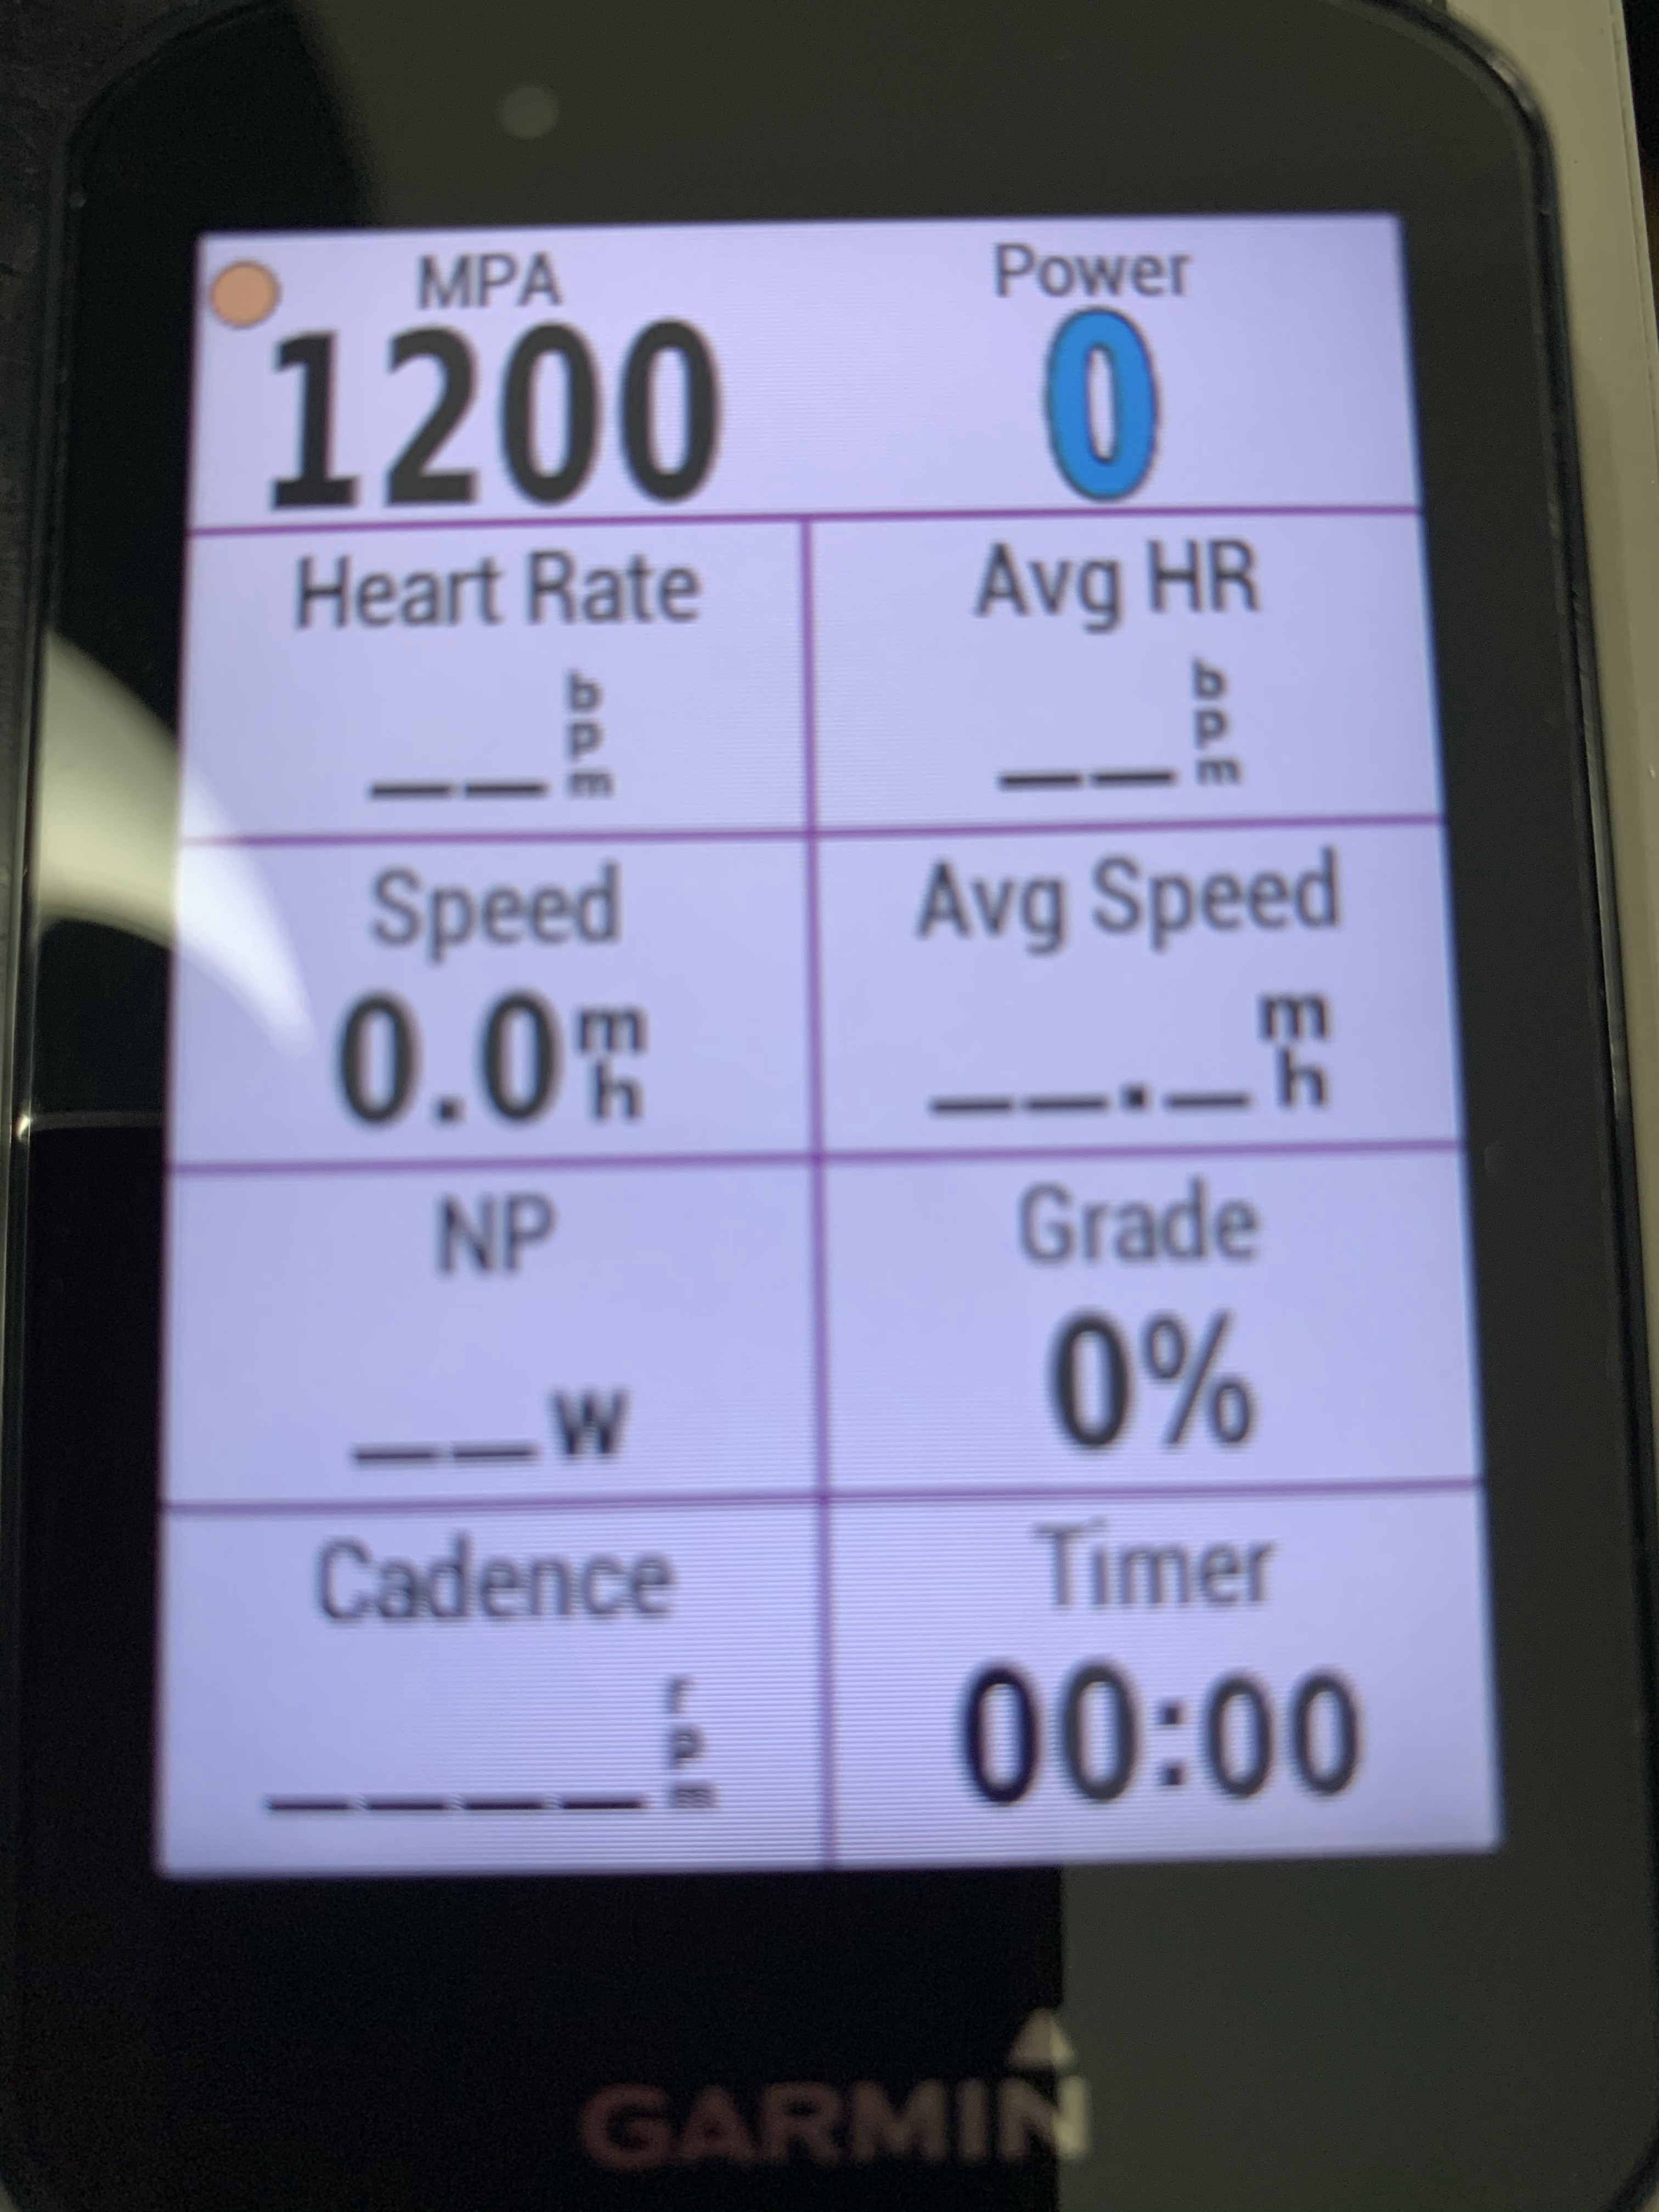
Indoors I use the Garmin to run my Xert workouts. When I’m not using the Garmin for that, here’s my indoors screen. As noted above, the MPA/Power is my go-to data field. If I was only allowed one piece of data, that’d be it! I like having Lap Power so that I can see where I am relative to my TP on longer intervals. The XSS/DS is the other Xert field I use, and is nice for motivation for long rides (XSS) or for intervals (I tend to be able to handle ridiculous DS values). You’ll see on the lower left that Garmin has a data field for the CORE non-invasive temperature sensor.
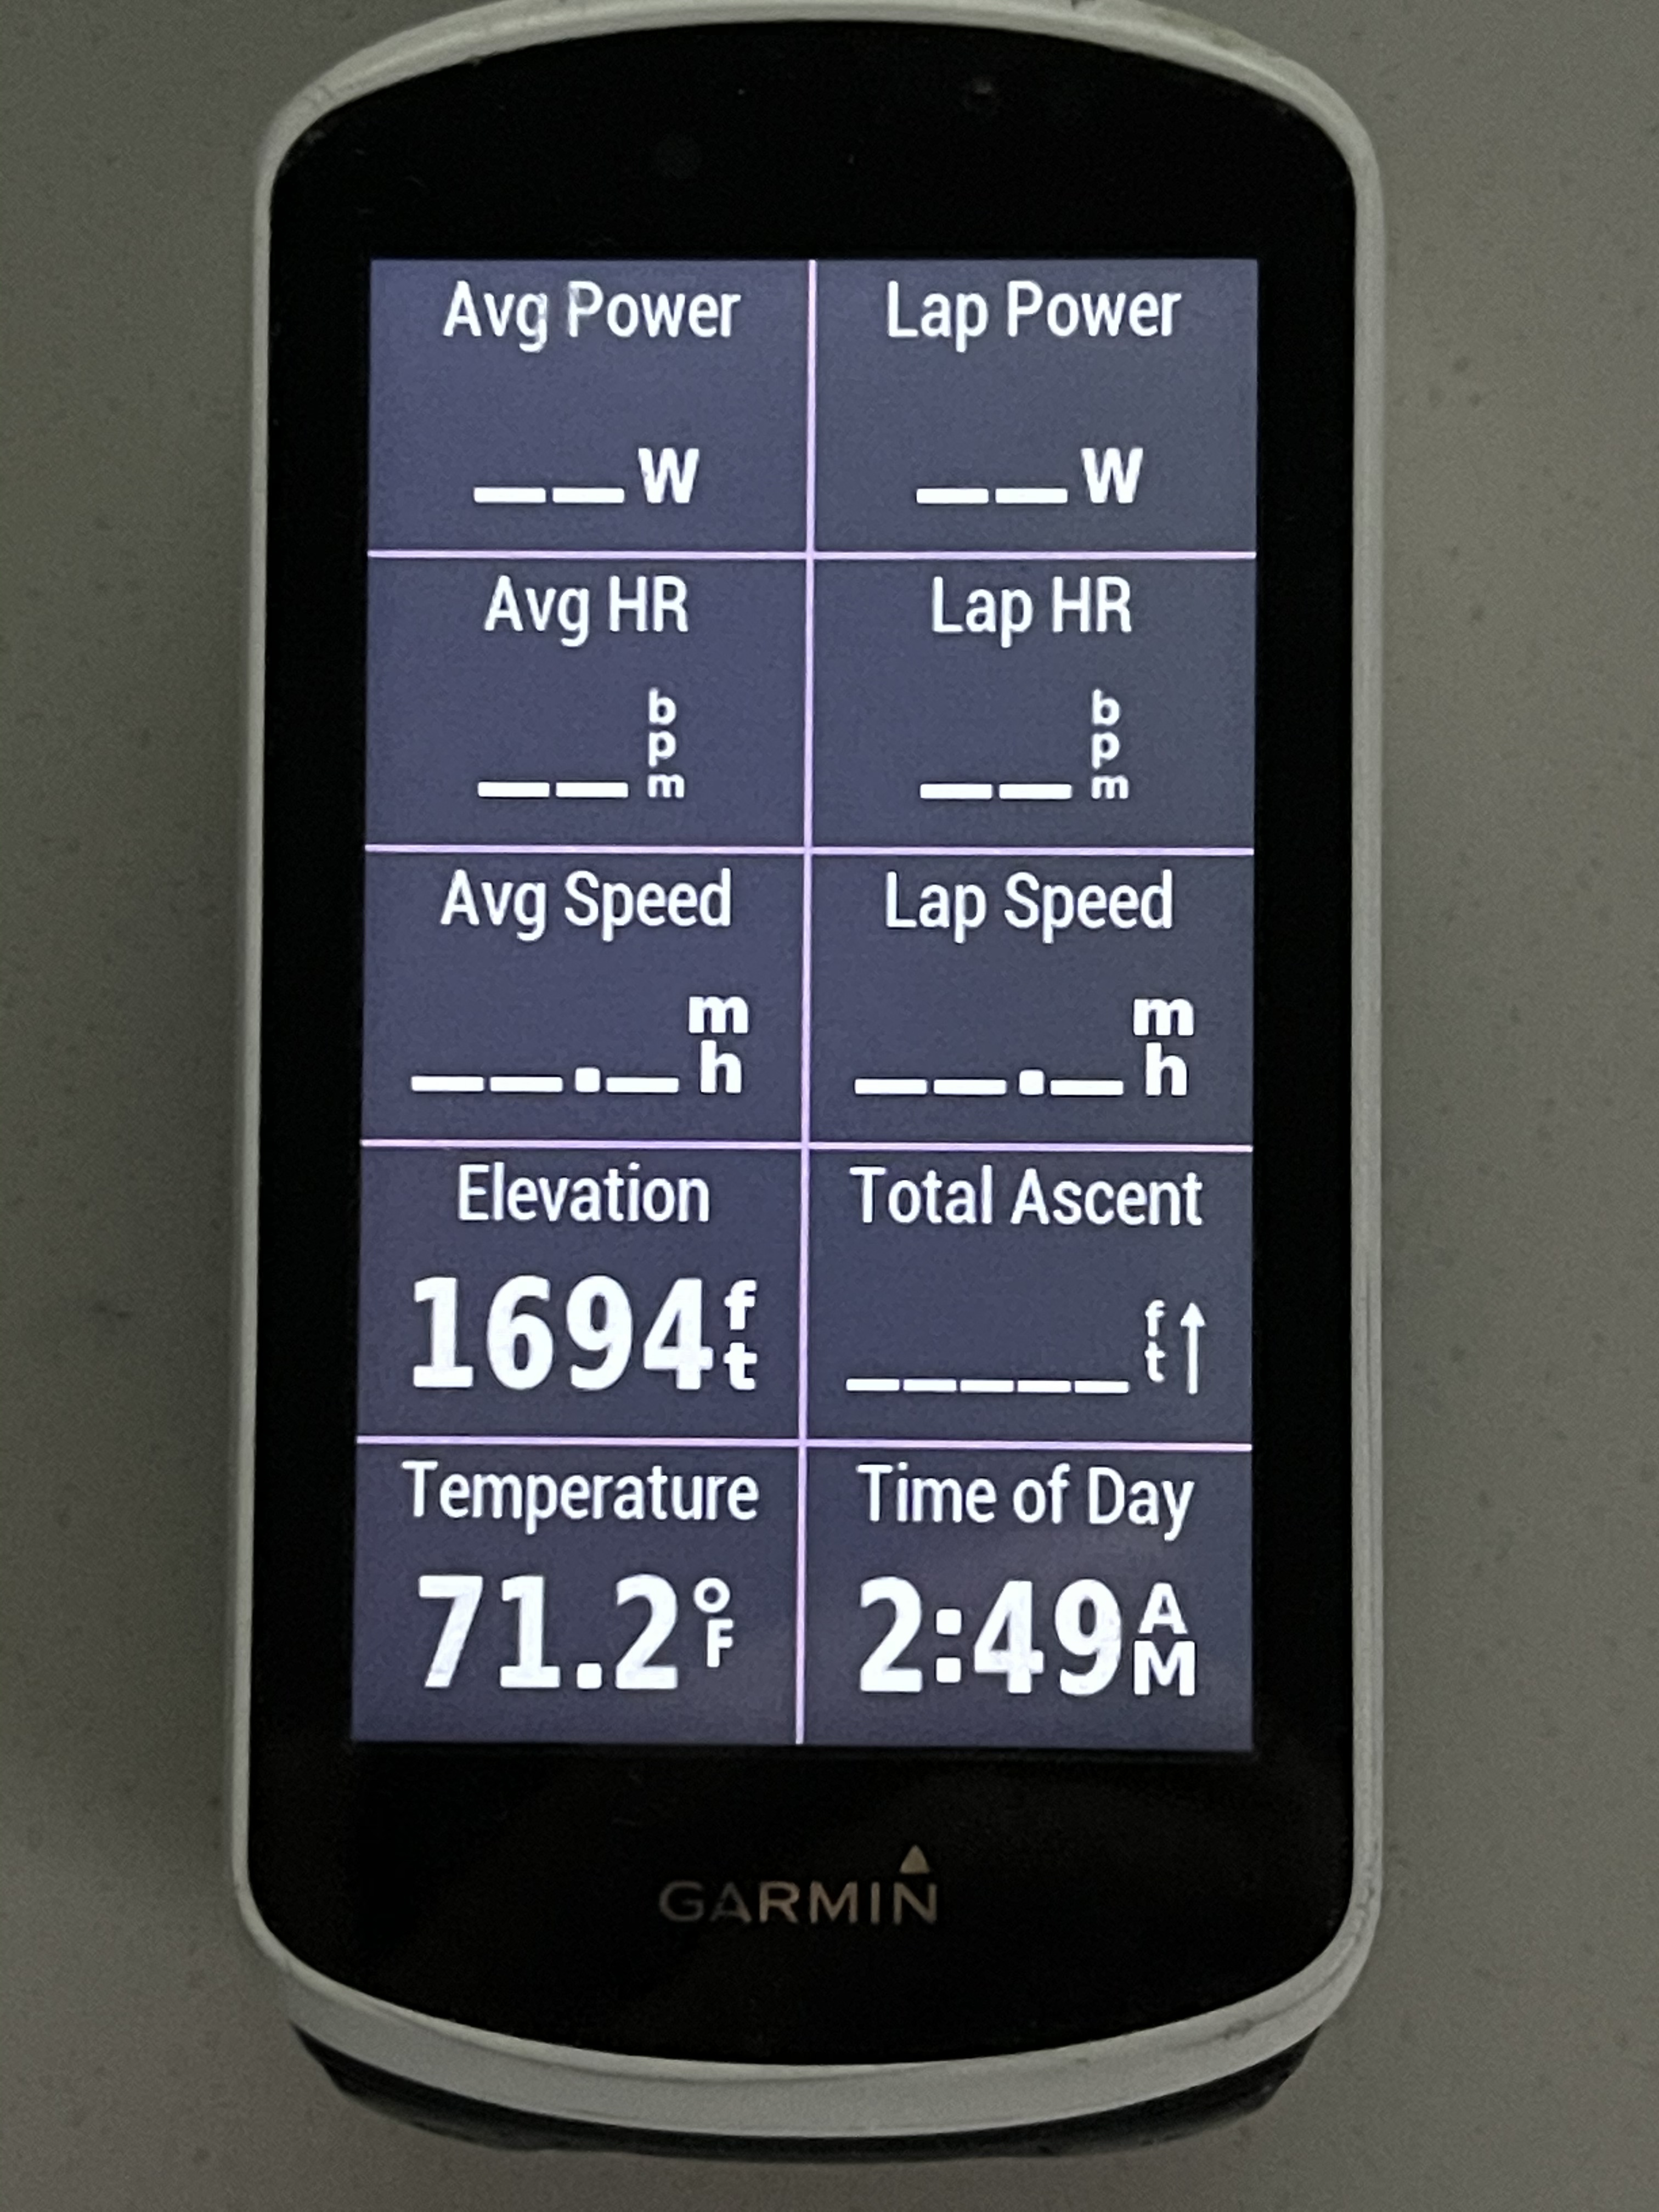
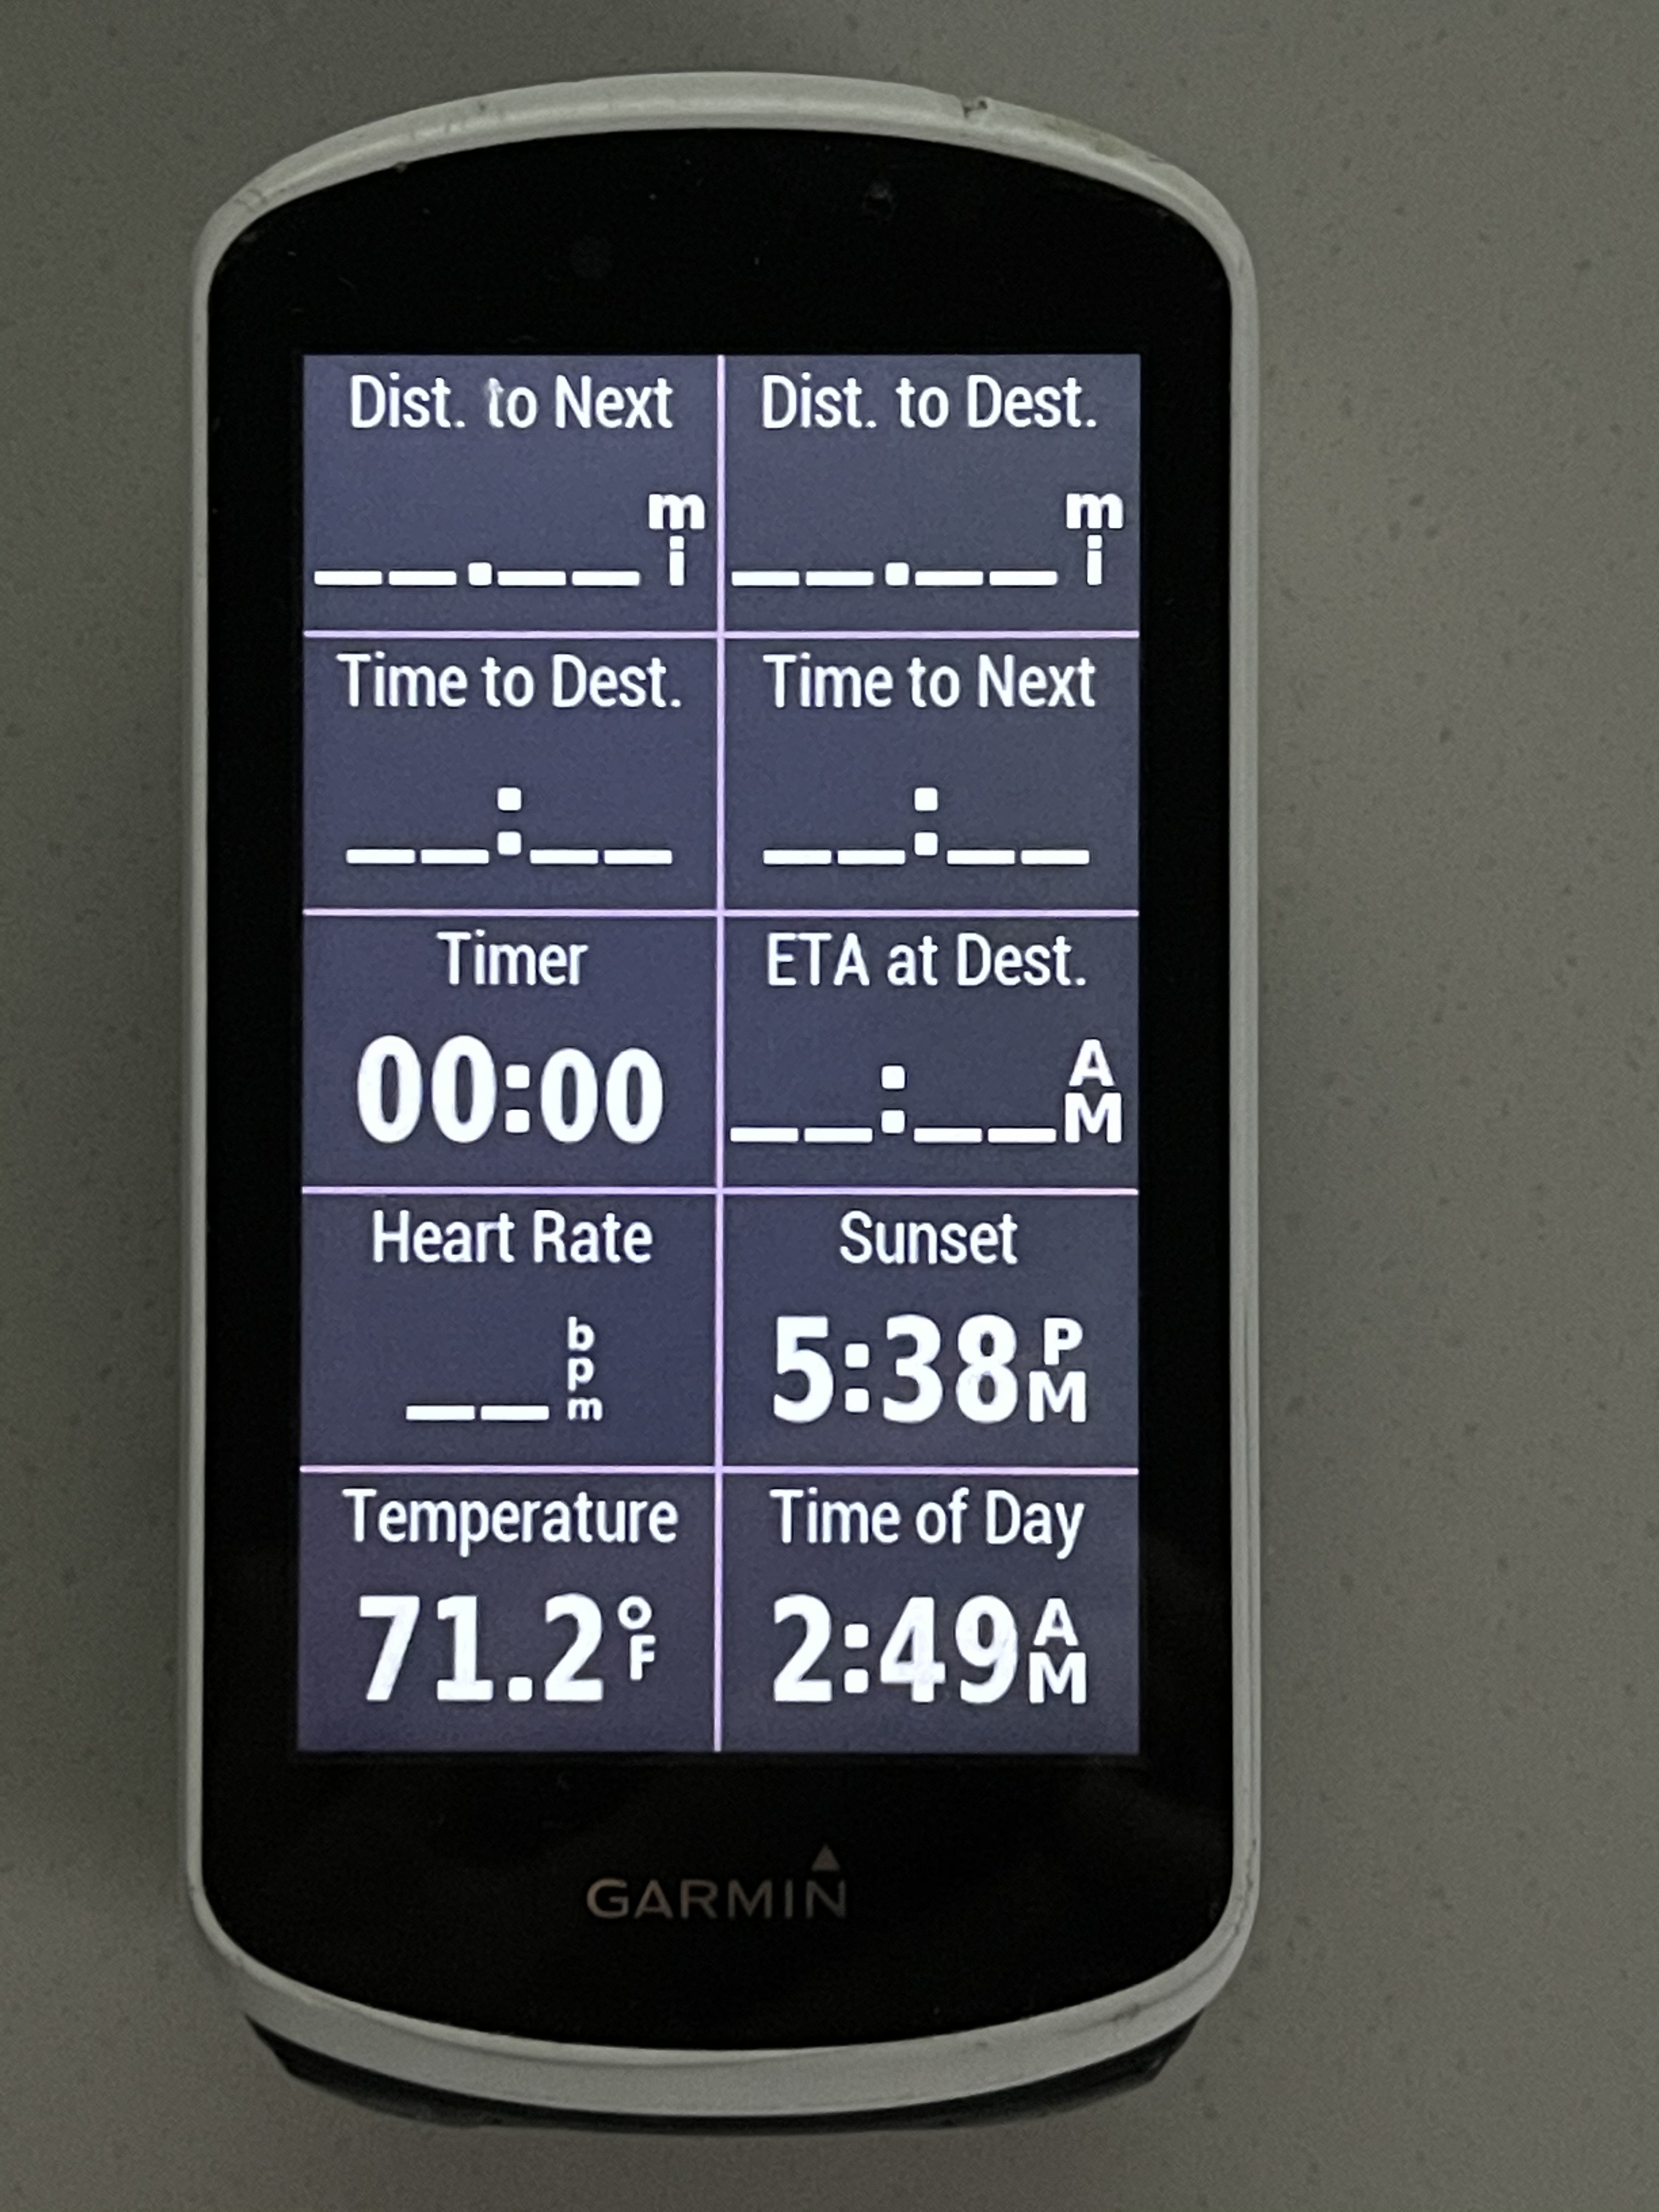
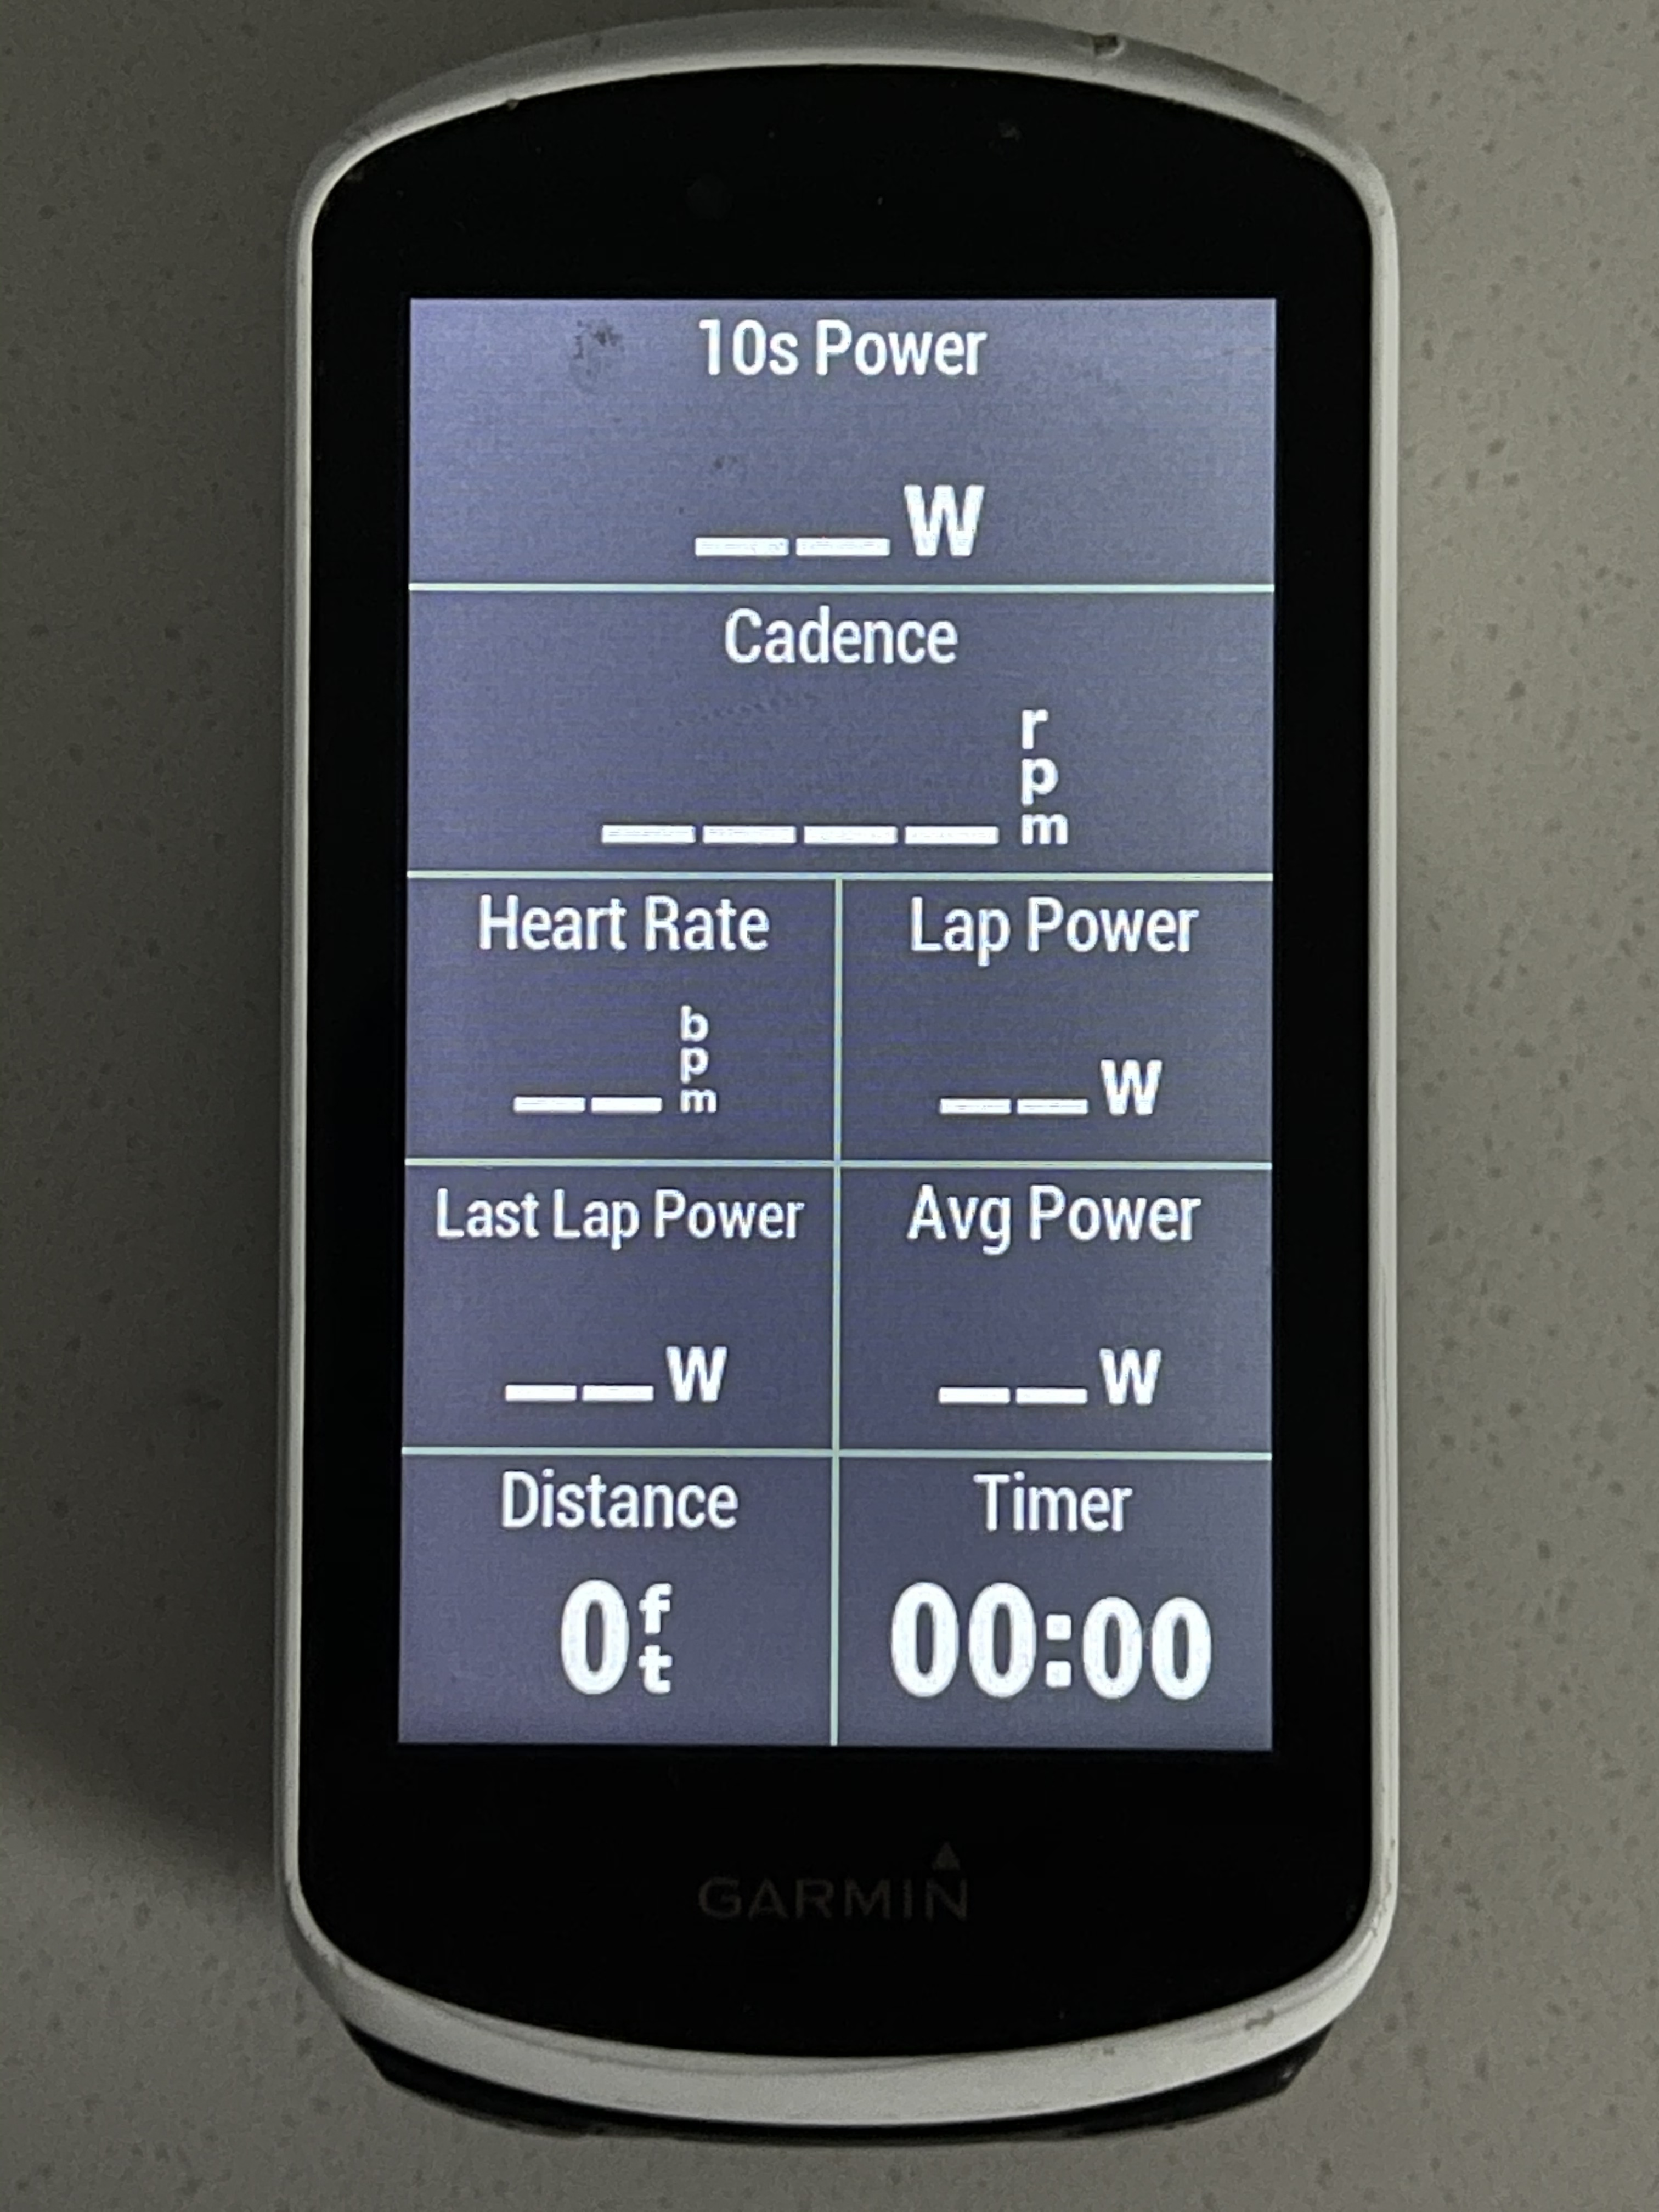
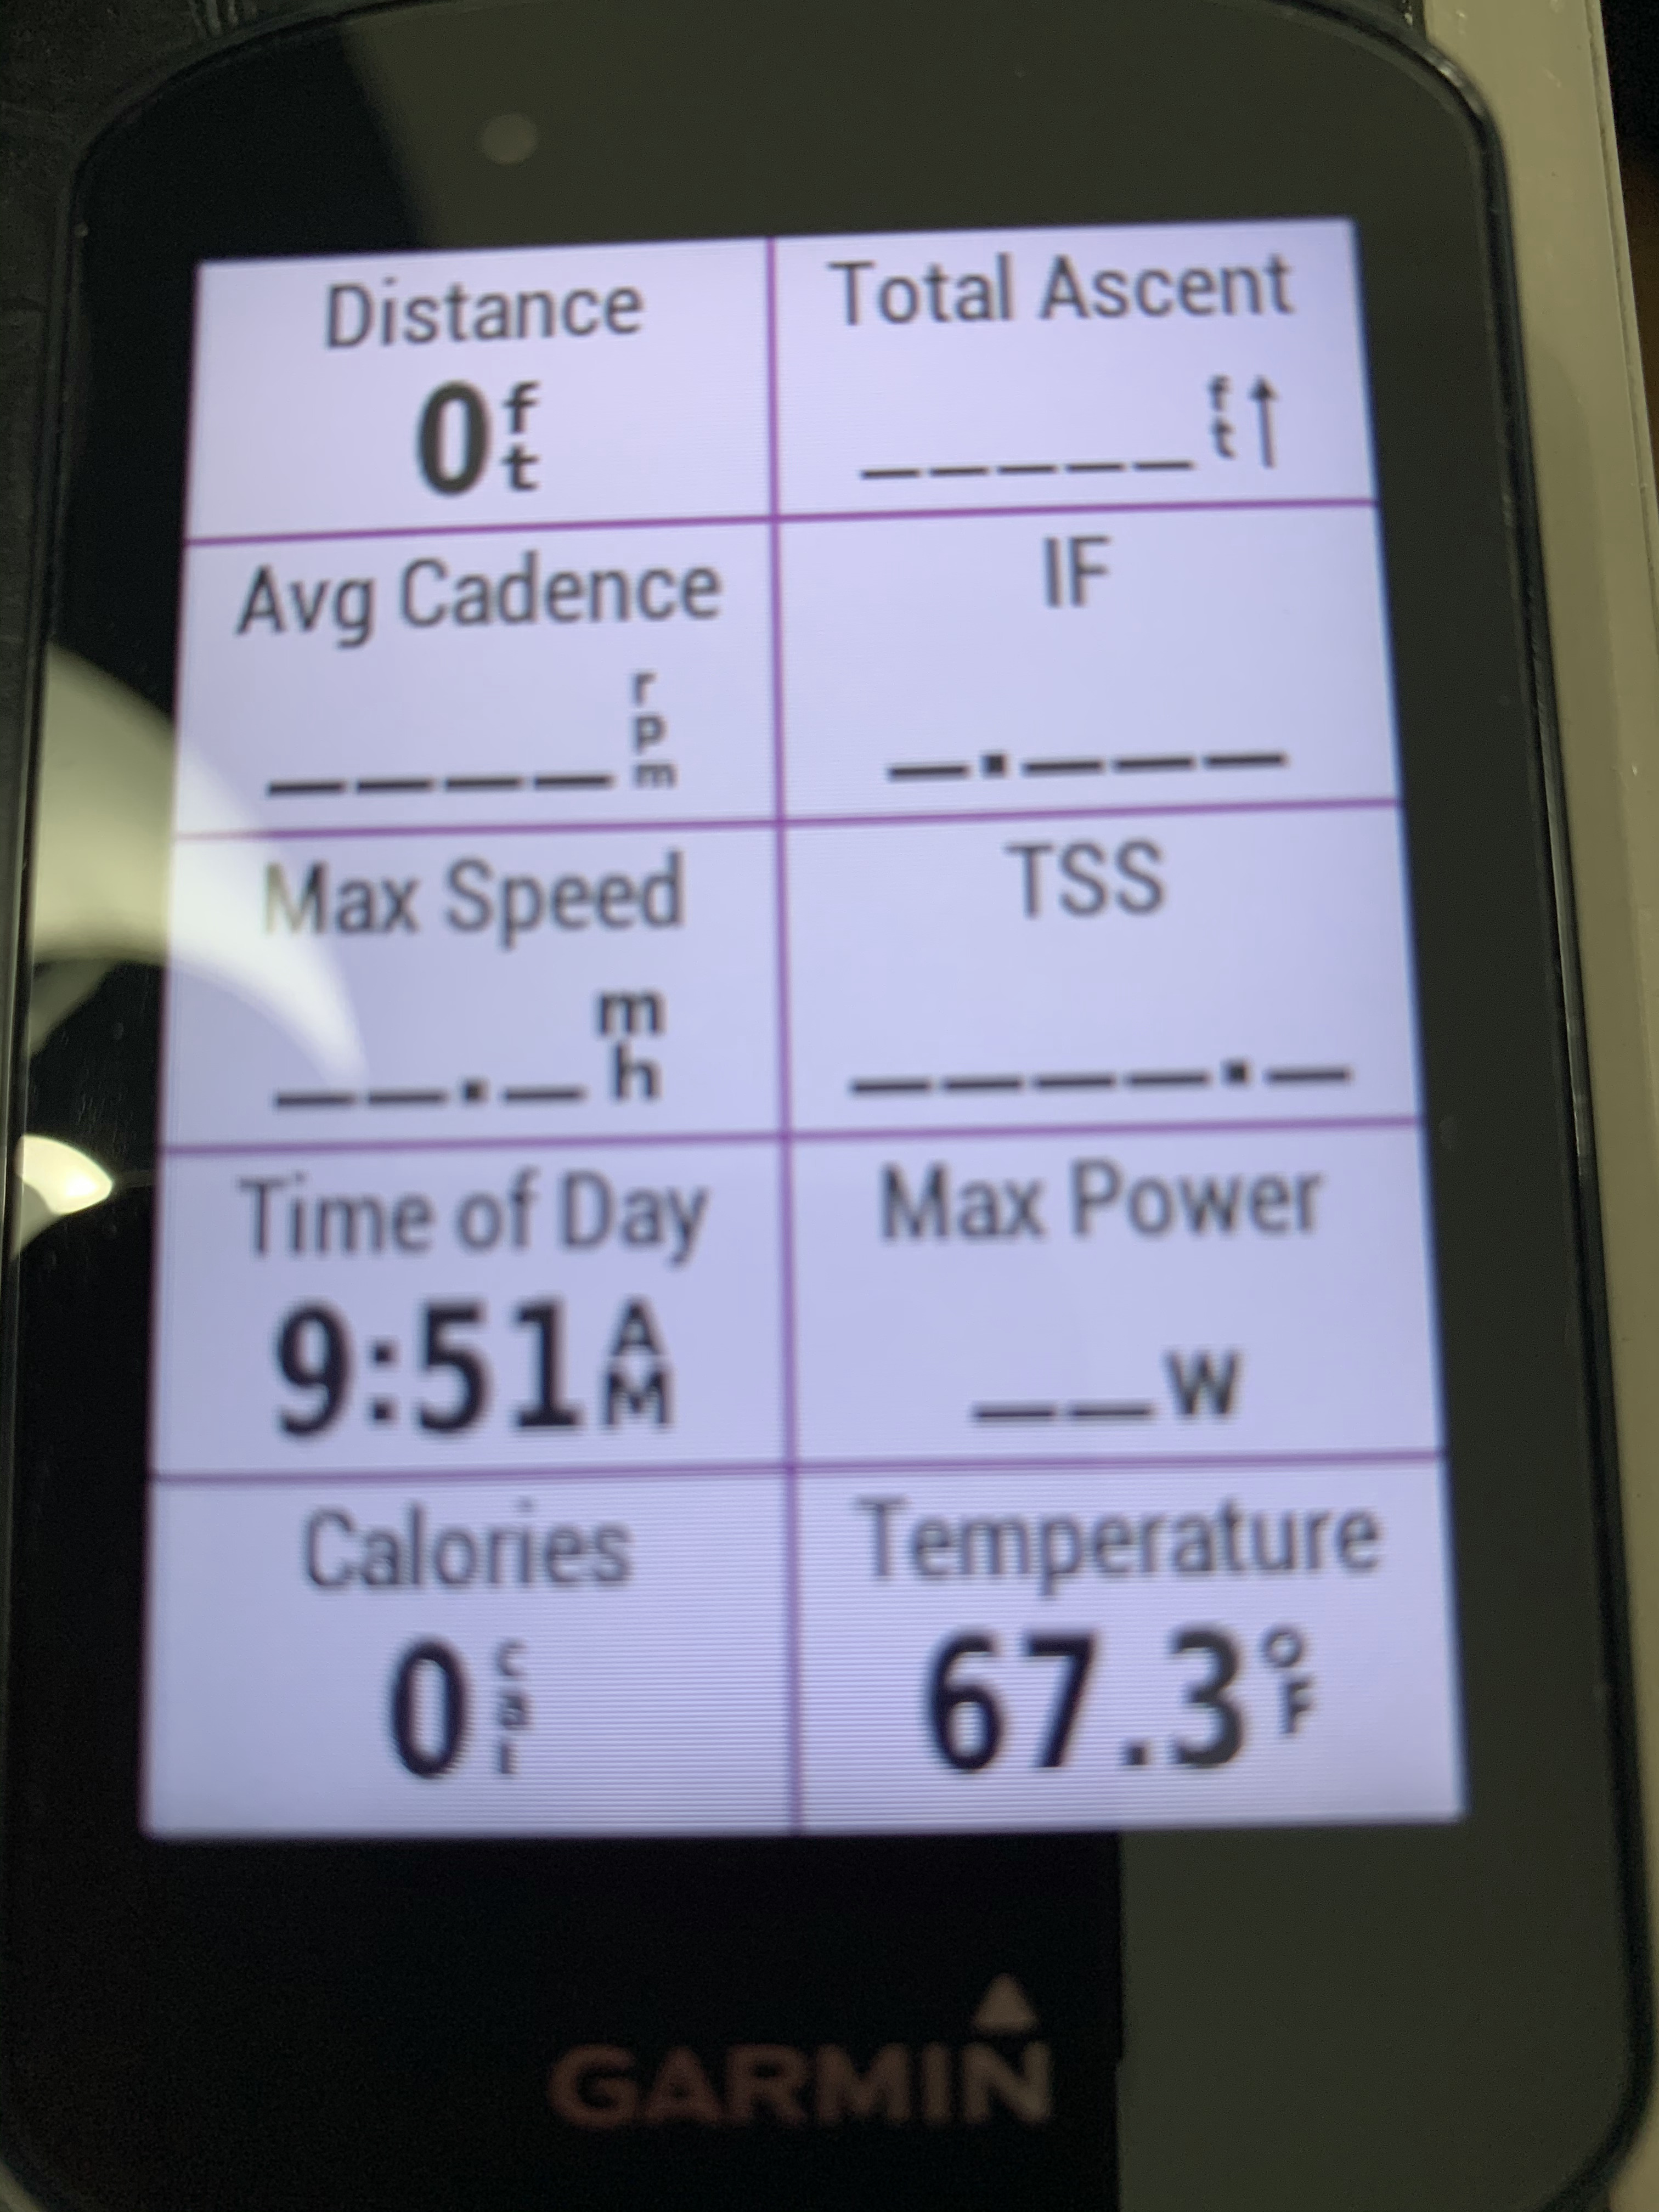
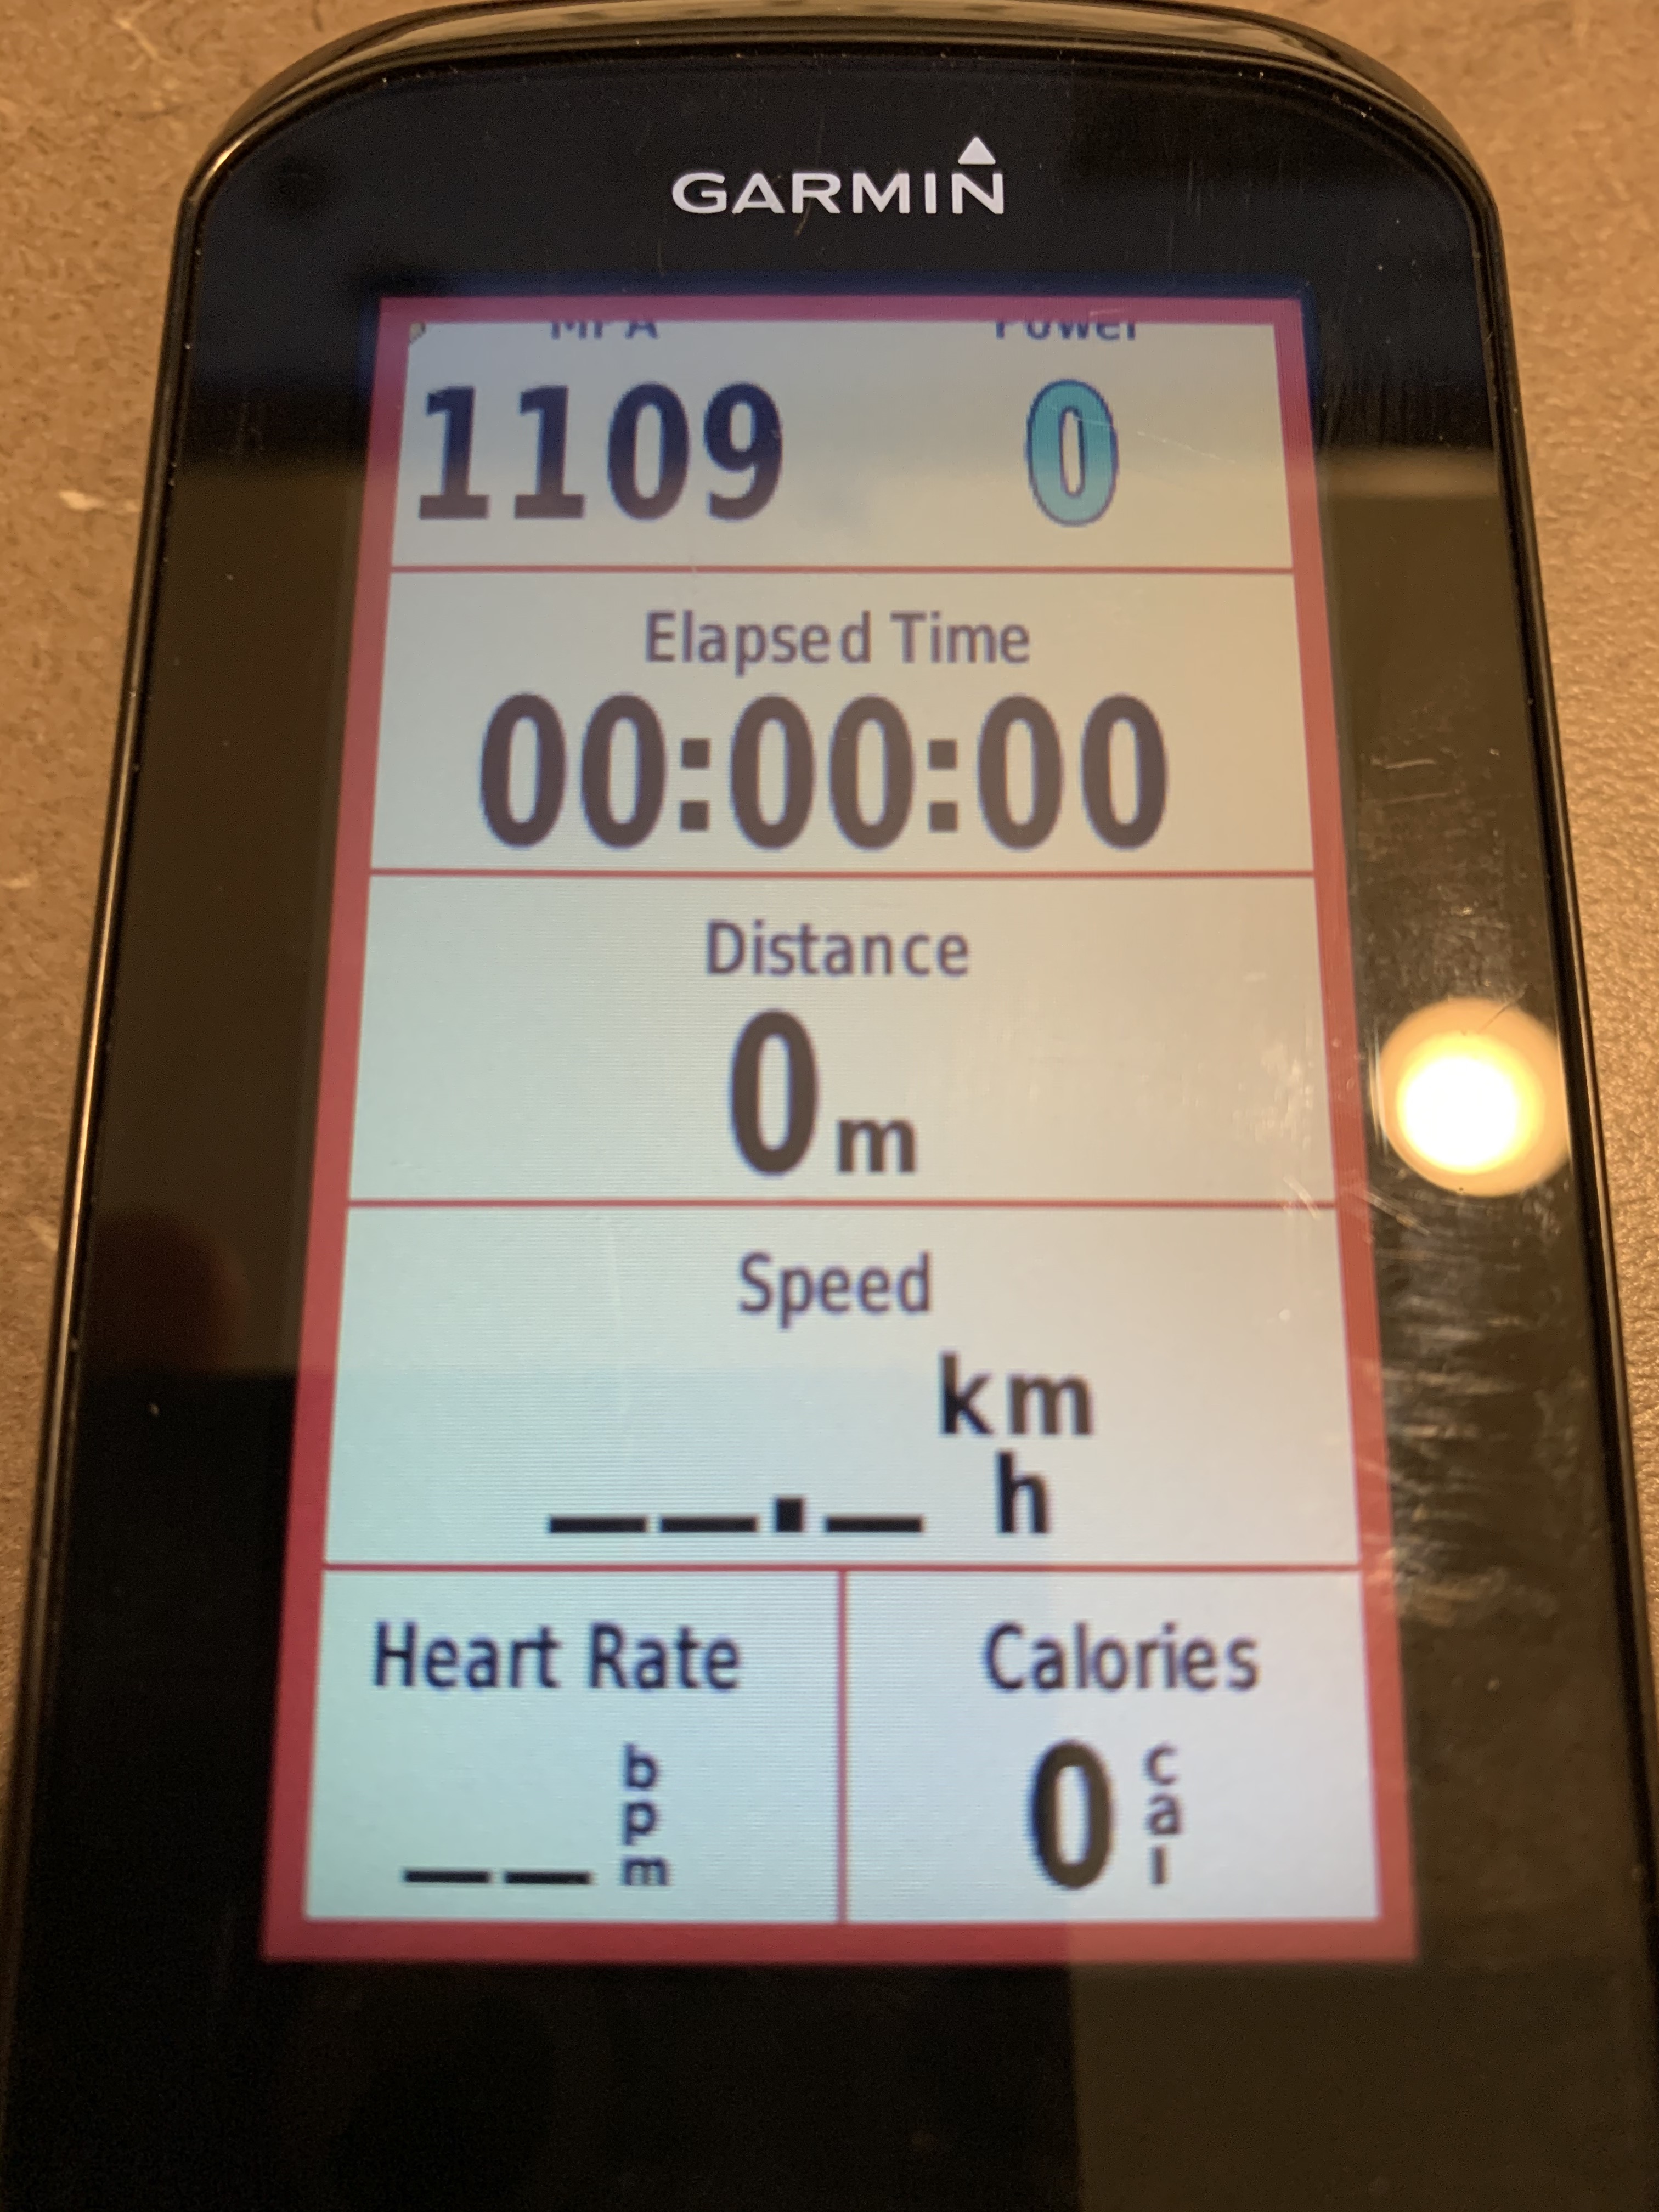
For outdoor training, this is the field I use for everything except for dedicated intervals. Pretty much has everything I care about. The calories is mostly there as a reminder to eat. Living in Niagara it’s pretty flat, so I don’t have a climbing metric or screen dedicated to that.
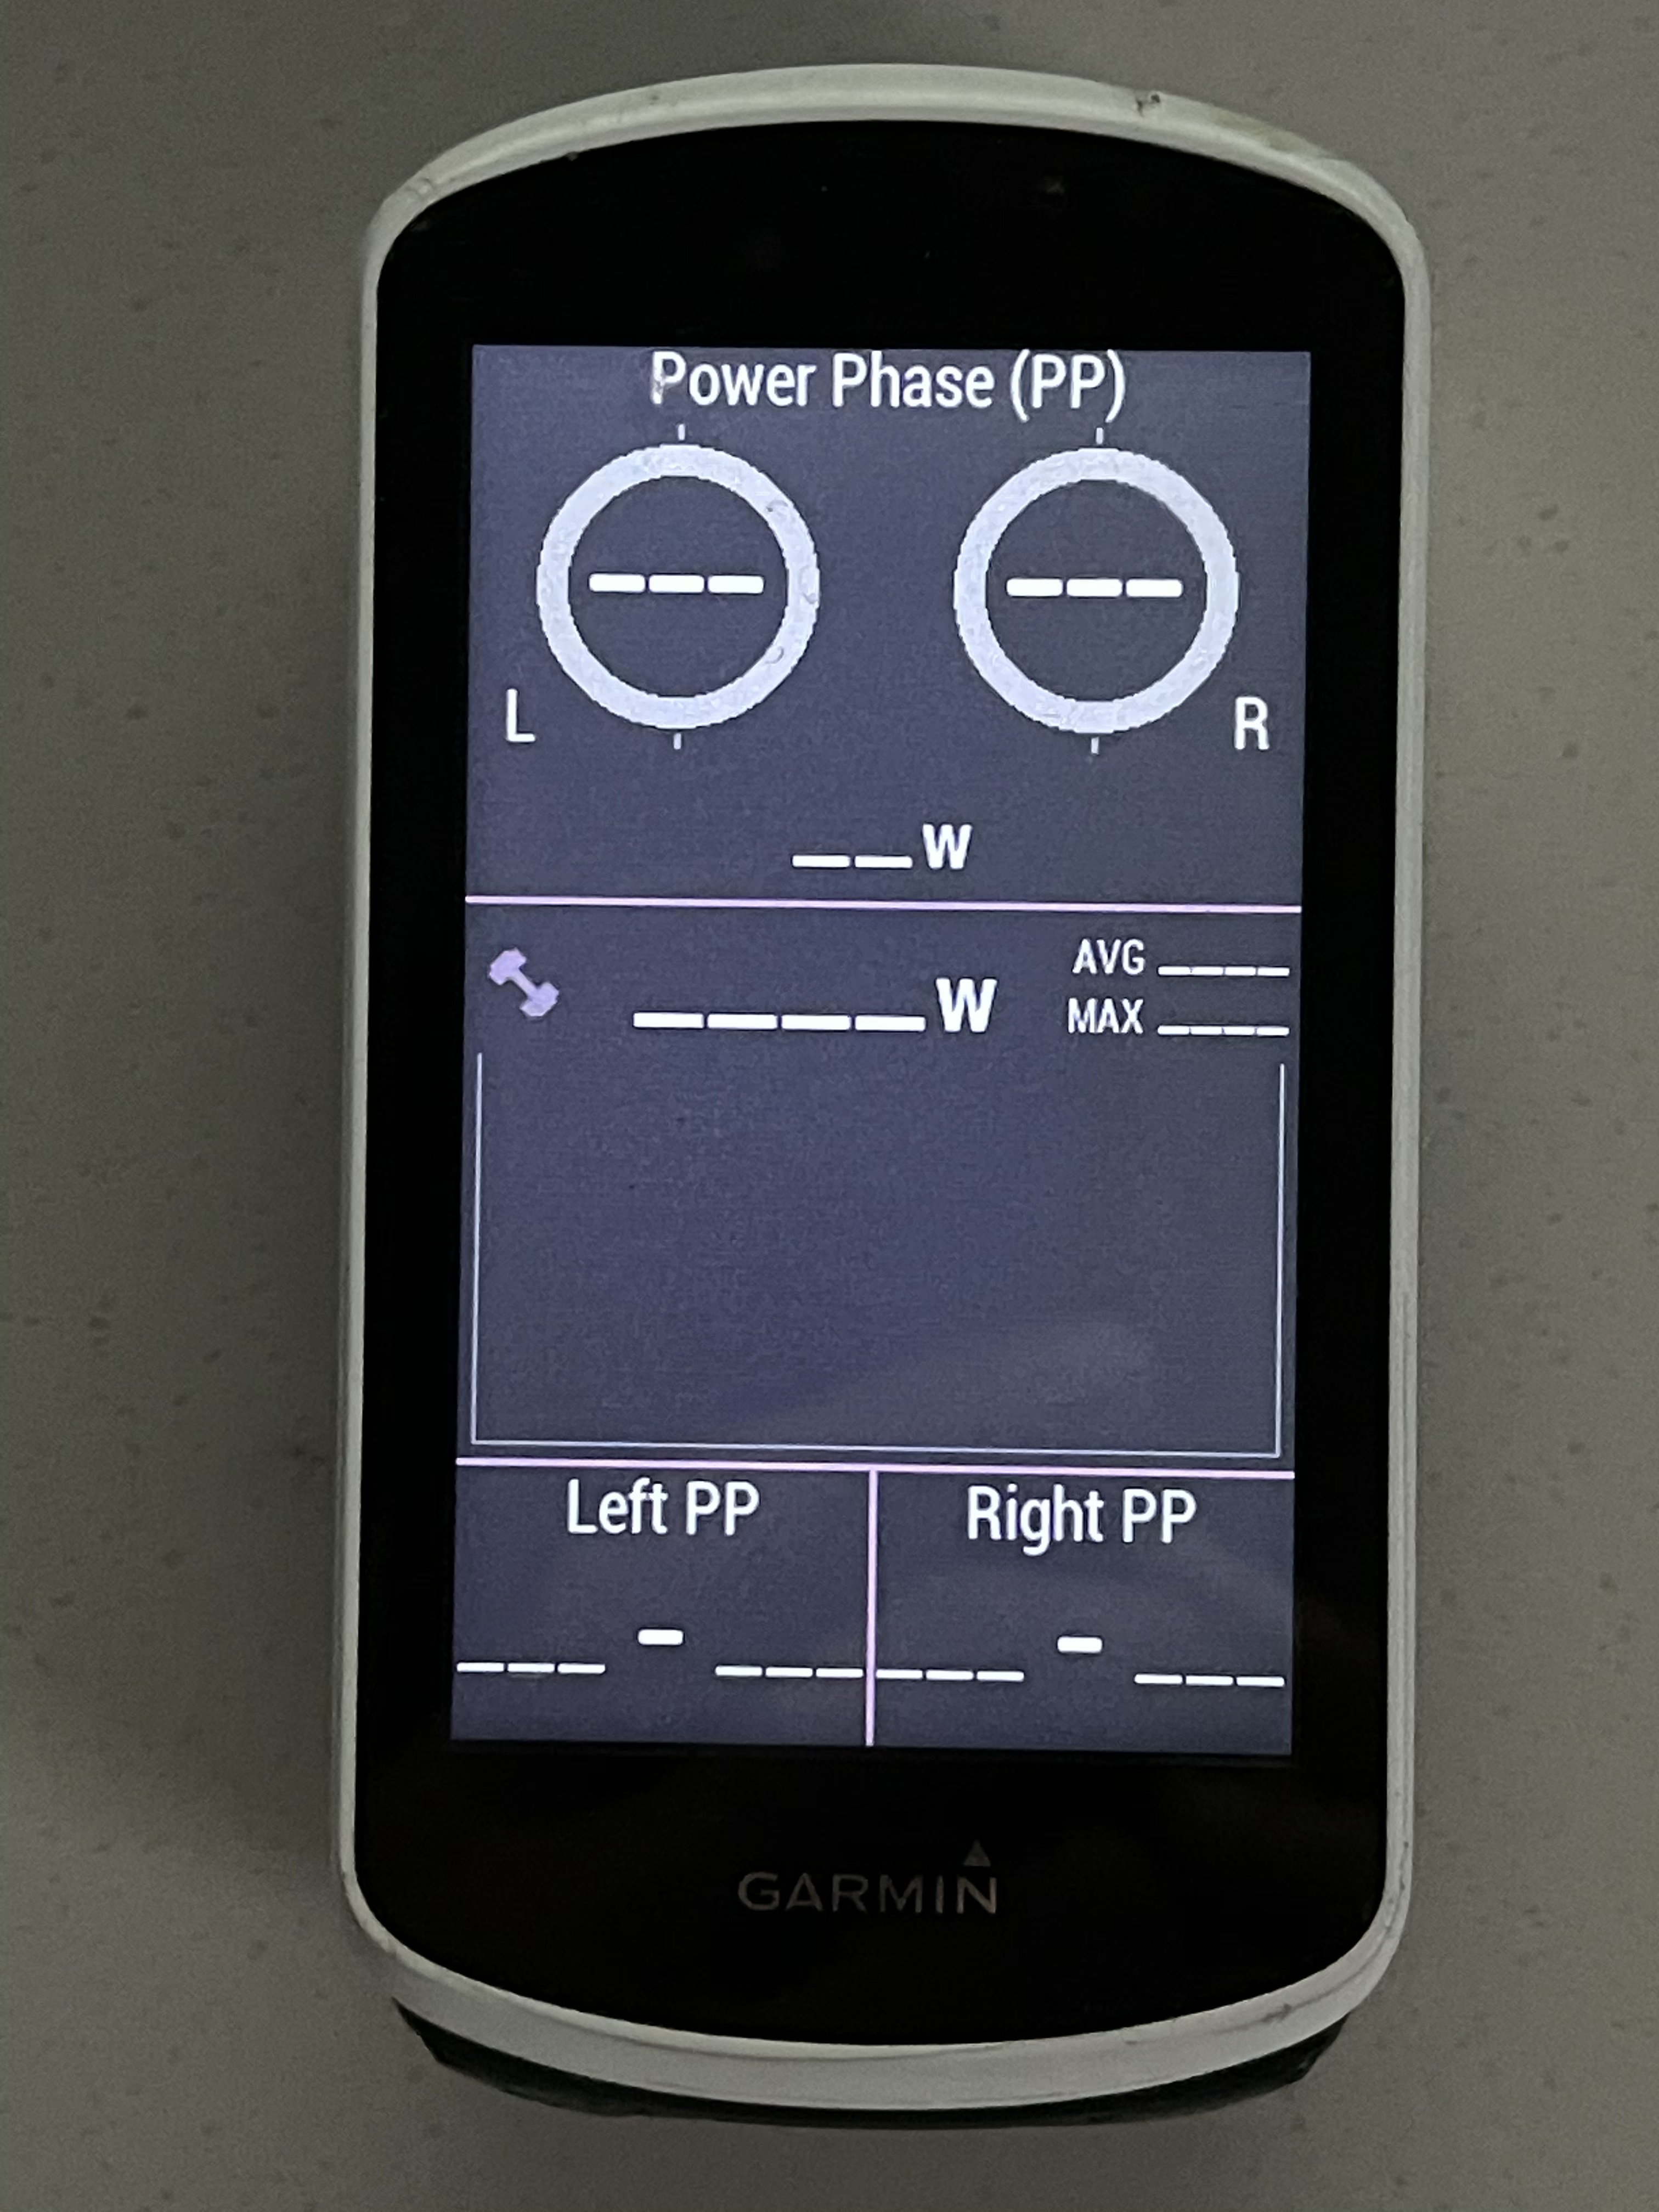
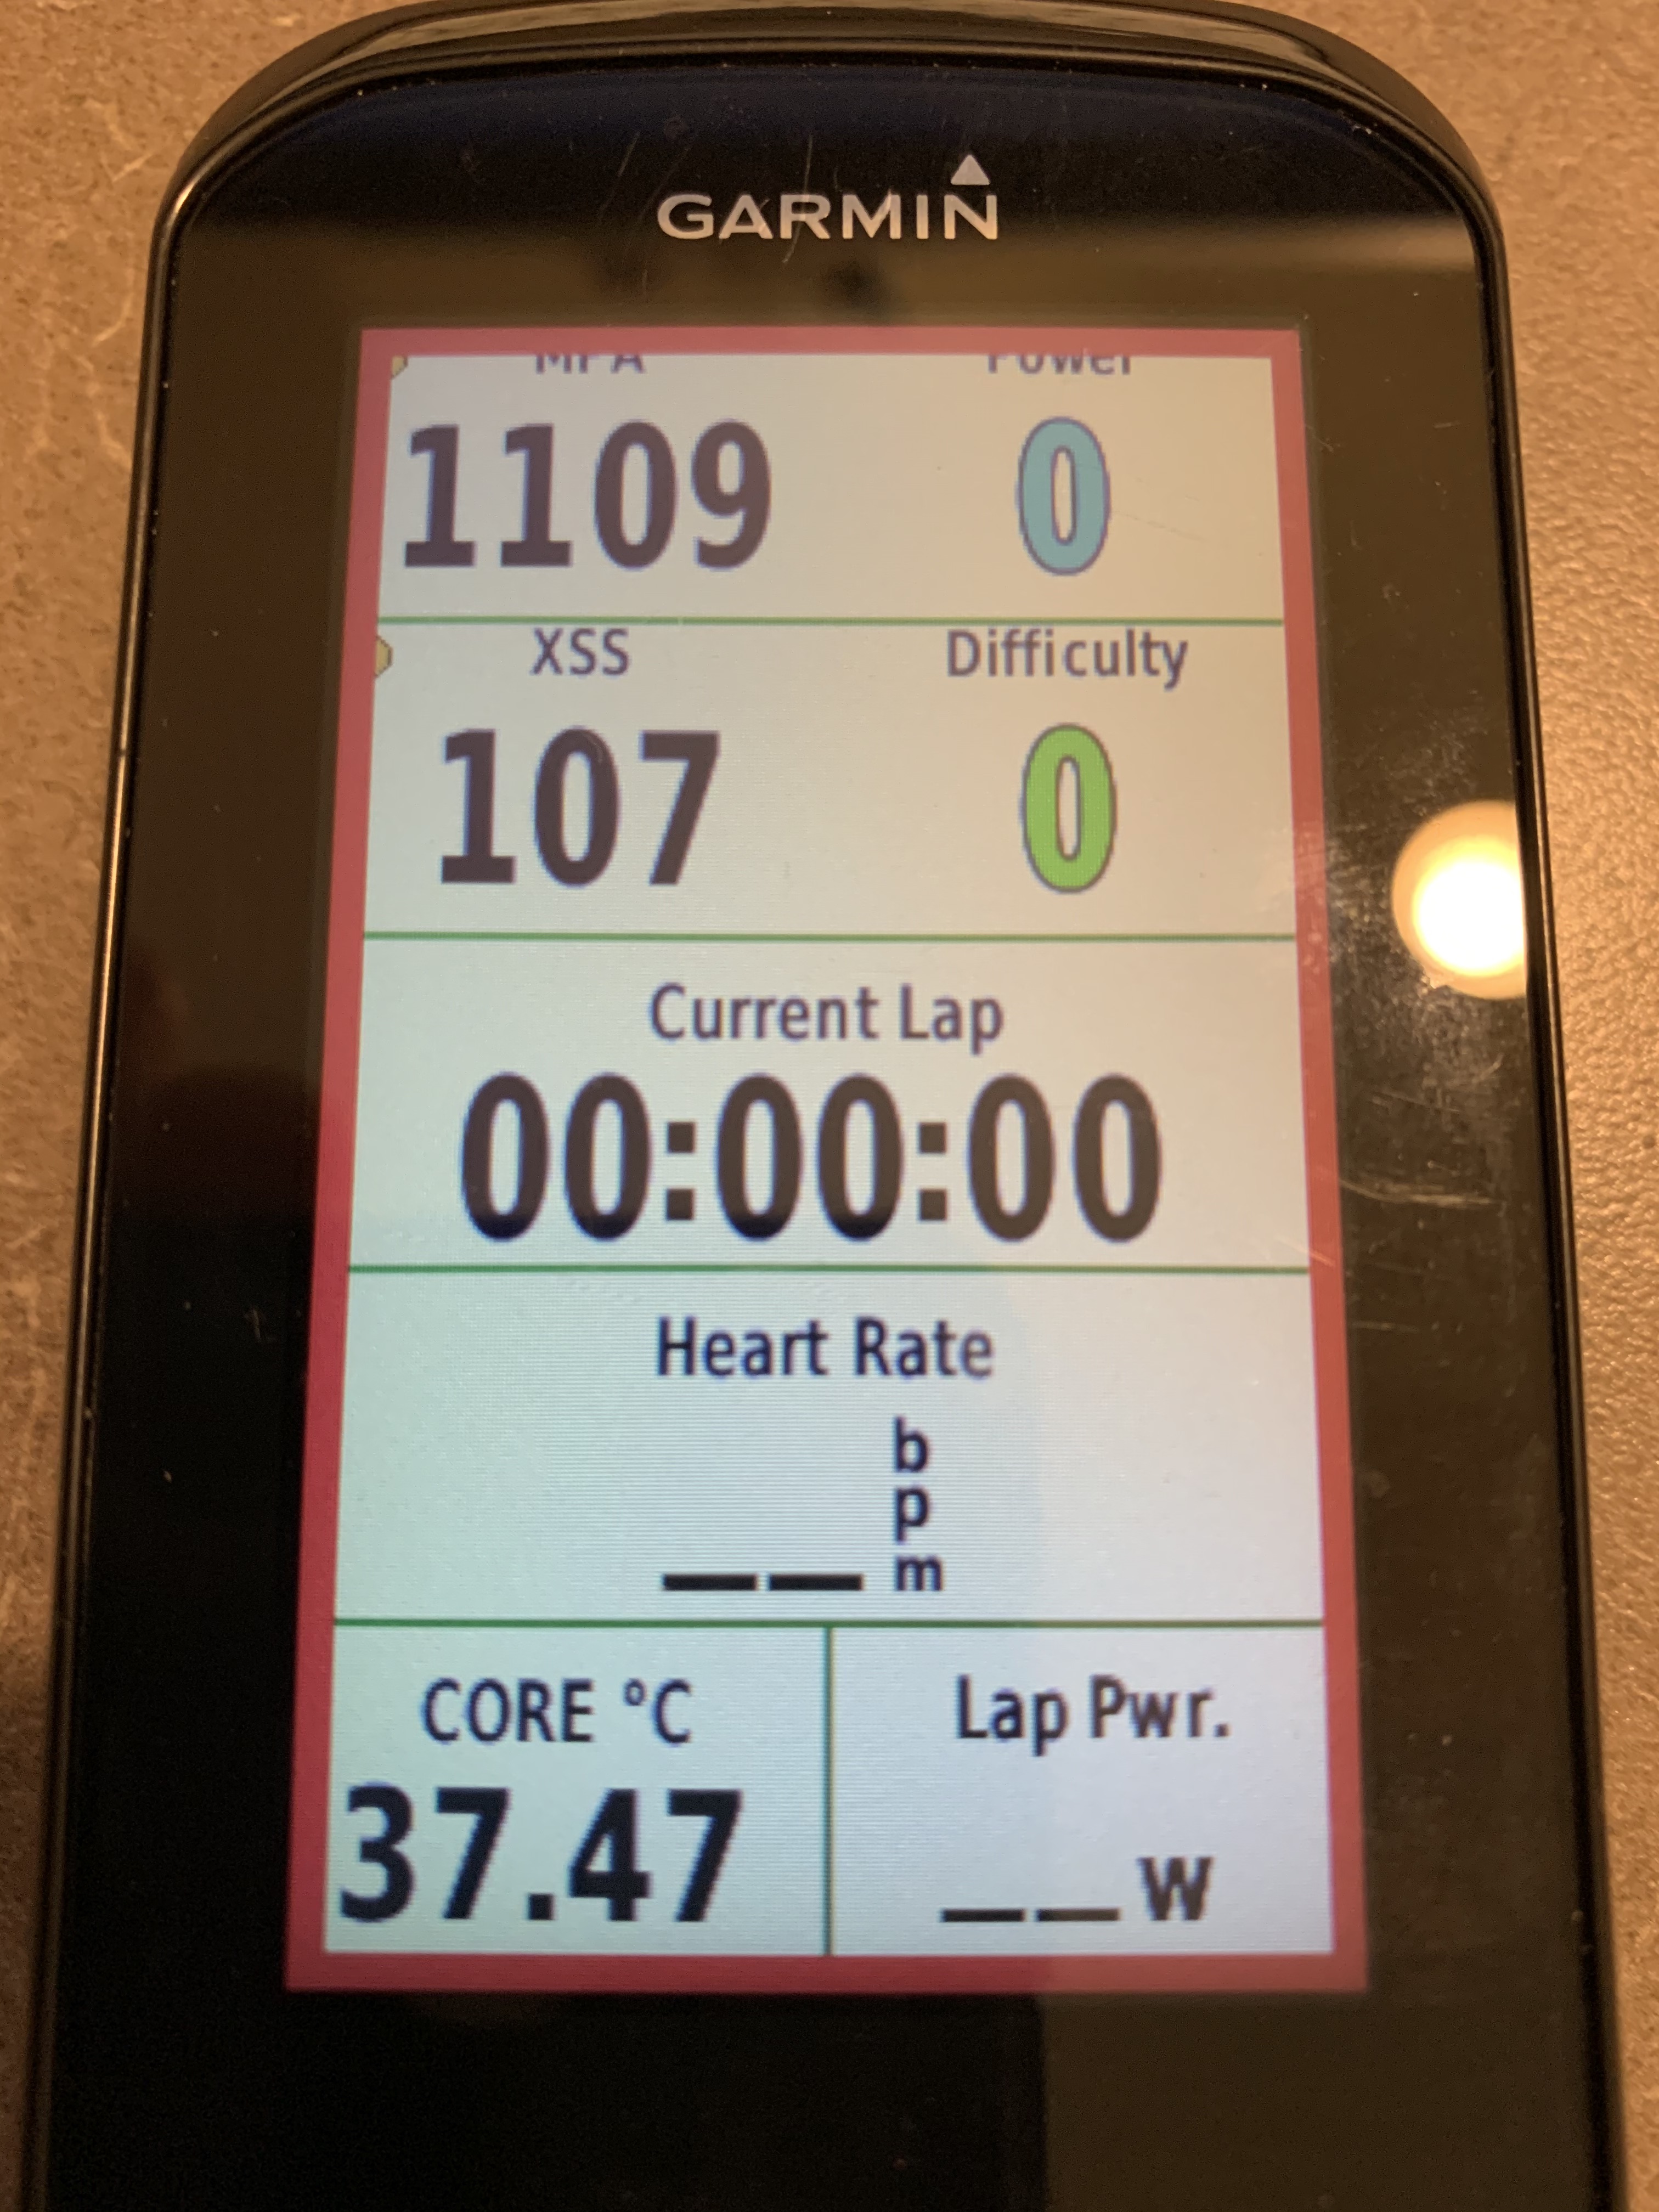
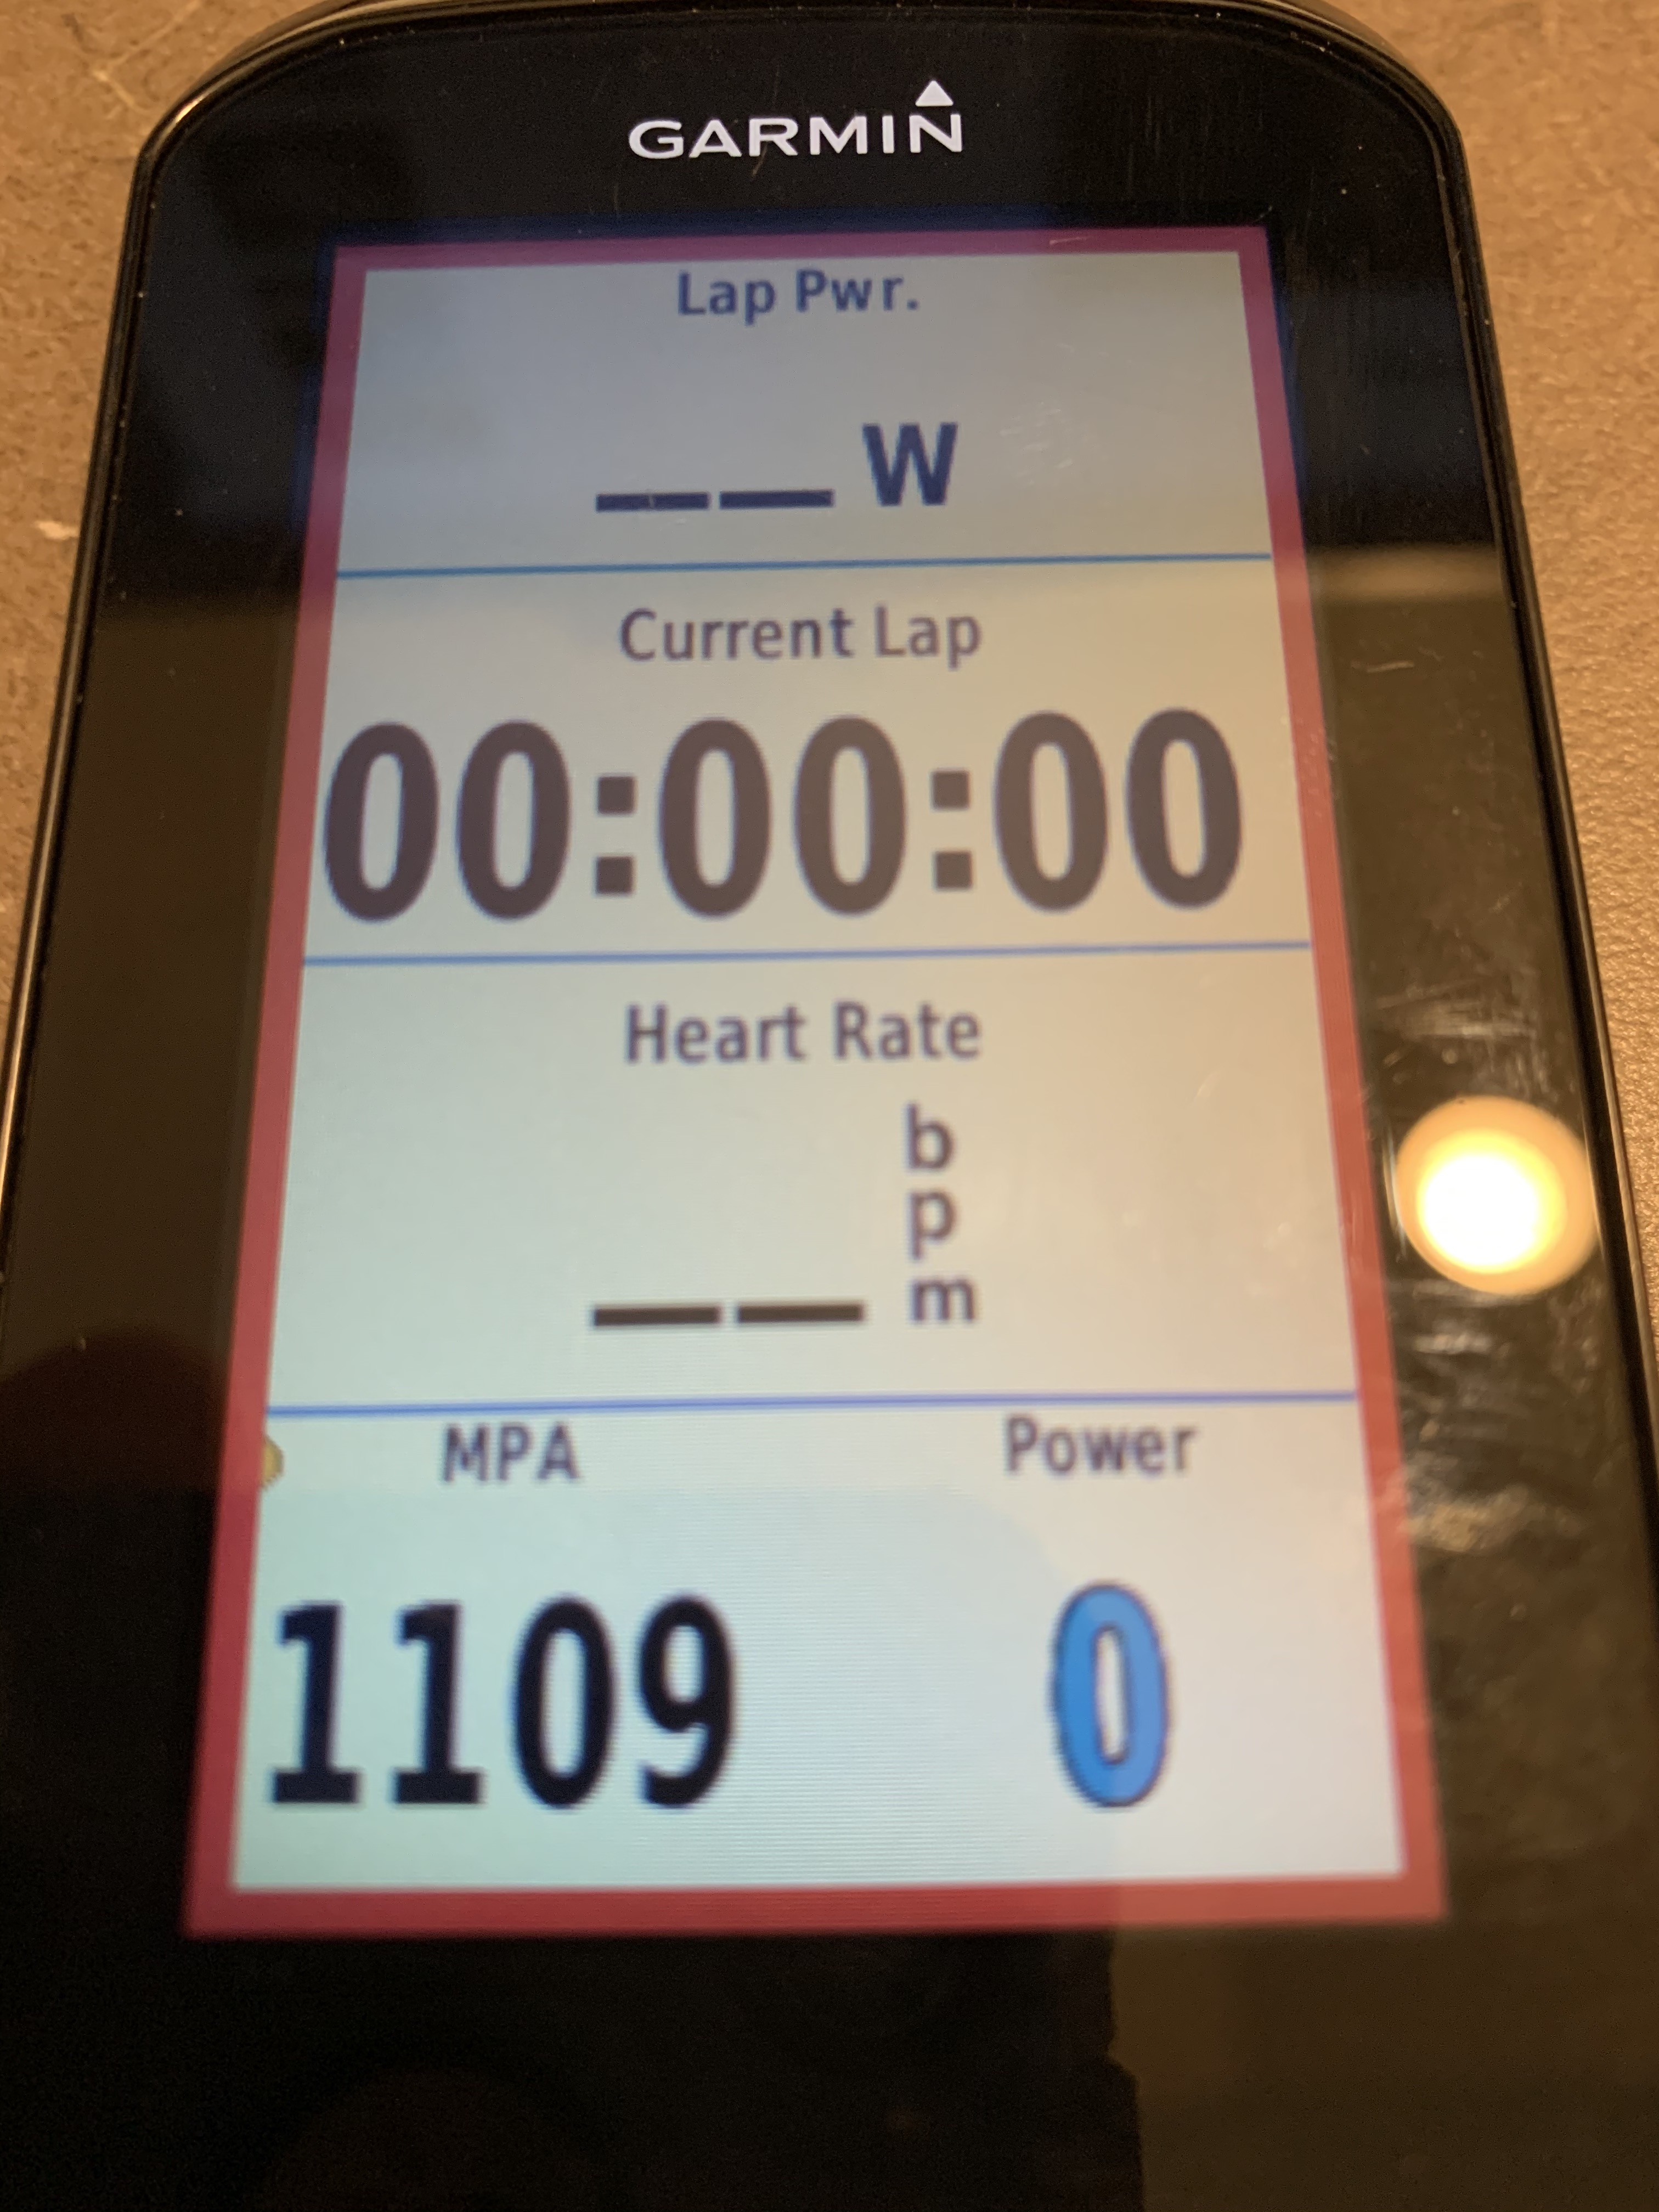
When doing intervals this is the screen I use. You can see from the Indoor description my reasons for these. When I’m doing “Stomps” neuromuscular intervals where I’m accelerating a big gear from a low cadence, or sprint training in general, I’ll replace the Lap Power with Peak Lap Power.
My pretty plain and simple Racing screen. When it’s CX cadence is pretty much irrelevant, so I don’t really have it on my racing screen. Calories is there again to remind me to eat on longer gravel races.
So I’m pretty basic with my data while riding. MPA/Power is a must, HR on most screens, XSS/DS for motivation, Lap Power for ensuring intensity is there for intervals, and Calories to remind me to eat.
you guys are able to make use of a lot of data during races, and i’m not sure that I could effectively use it. Too much “cognitive load” (callback to another thread and podcast episode :)).
I haven’t raced on the road in quite a while but back when I did, I only used (i) timer, (ii) speed (to see the spots each lap where the field is moving quickly) and (iii) distance (to estimate when key selection points were coming up). Power usually either wasn’t relevant or i was too focused / cross-eyed to look at it (I was either gonna stick with the move or not) and heart rate, good god I did not even want to know.
MTB (at least XC) I just want time and distance.
Although including kilojoules is a great idea. i also need to be reminded to eat, of all the things i’m bad at, that’s probably the one where i’m worst.
(i also took the tip of adding that to each of my screens: long road ride, long mtb ride, and intervals.
If you do have the option of having power on the MTB, even for XC, I think it can be very helpful. However, you mention kJ’s and that’s a great option to display too. When I was having issues cramping years ago, I got tuned into kJ’s and realized I was averaging a certain amount per hour, and then compared that to my races to see how it compared. It was easy to see that 1) I was over-pacing myself slightly during races, as expected, and doing more work in the first 60-90 minutes and then would pay for it by the 2-2.5 hour mark, and 2) it was easier to see how much fueling was needed to keep a high influx of energy to support that work.
Finally, its was useful in terms of seeing that I needed “x” kJ’s for a certain race or type of race, and then could adjust my rides to achieve the appropriate overload to better prepare the body for the work necessary.
Thanks, I’ll give it a shot including power. It’d be nice to have up there as a motivator in any event!
But courses near me generally are pretty tight (i.e. short laps) and any place where you’re both (i) really jamming and (ii) able to look at a computer are so short that you’re not really measuring effort. I.e. there’s no long fireroad climbs or anything like that.

 page are pretty similar, but I also include VAM because I don’t always trust my powermeter and VAM (for hills, of course) is an absolute climbing metric.