Hi folks,
Here are two workout protocols I found interesting while reading Skiba’s new book. I used Golden Cheetah to create the workouts because it allows me to enter my own values for CP and W’.
The first is from Vanhatalo et al., 2008. The protocol included two workouts, one done twice per week and the other done once per week. After four weeks of this intervention, VO2 Peak improved by 10%, Pmax (ramp test) by 7%, and power at the gas exchange threshold (GET) increased by 26%.
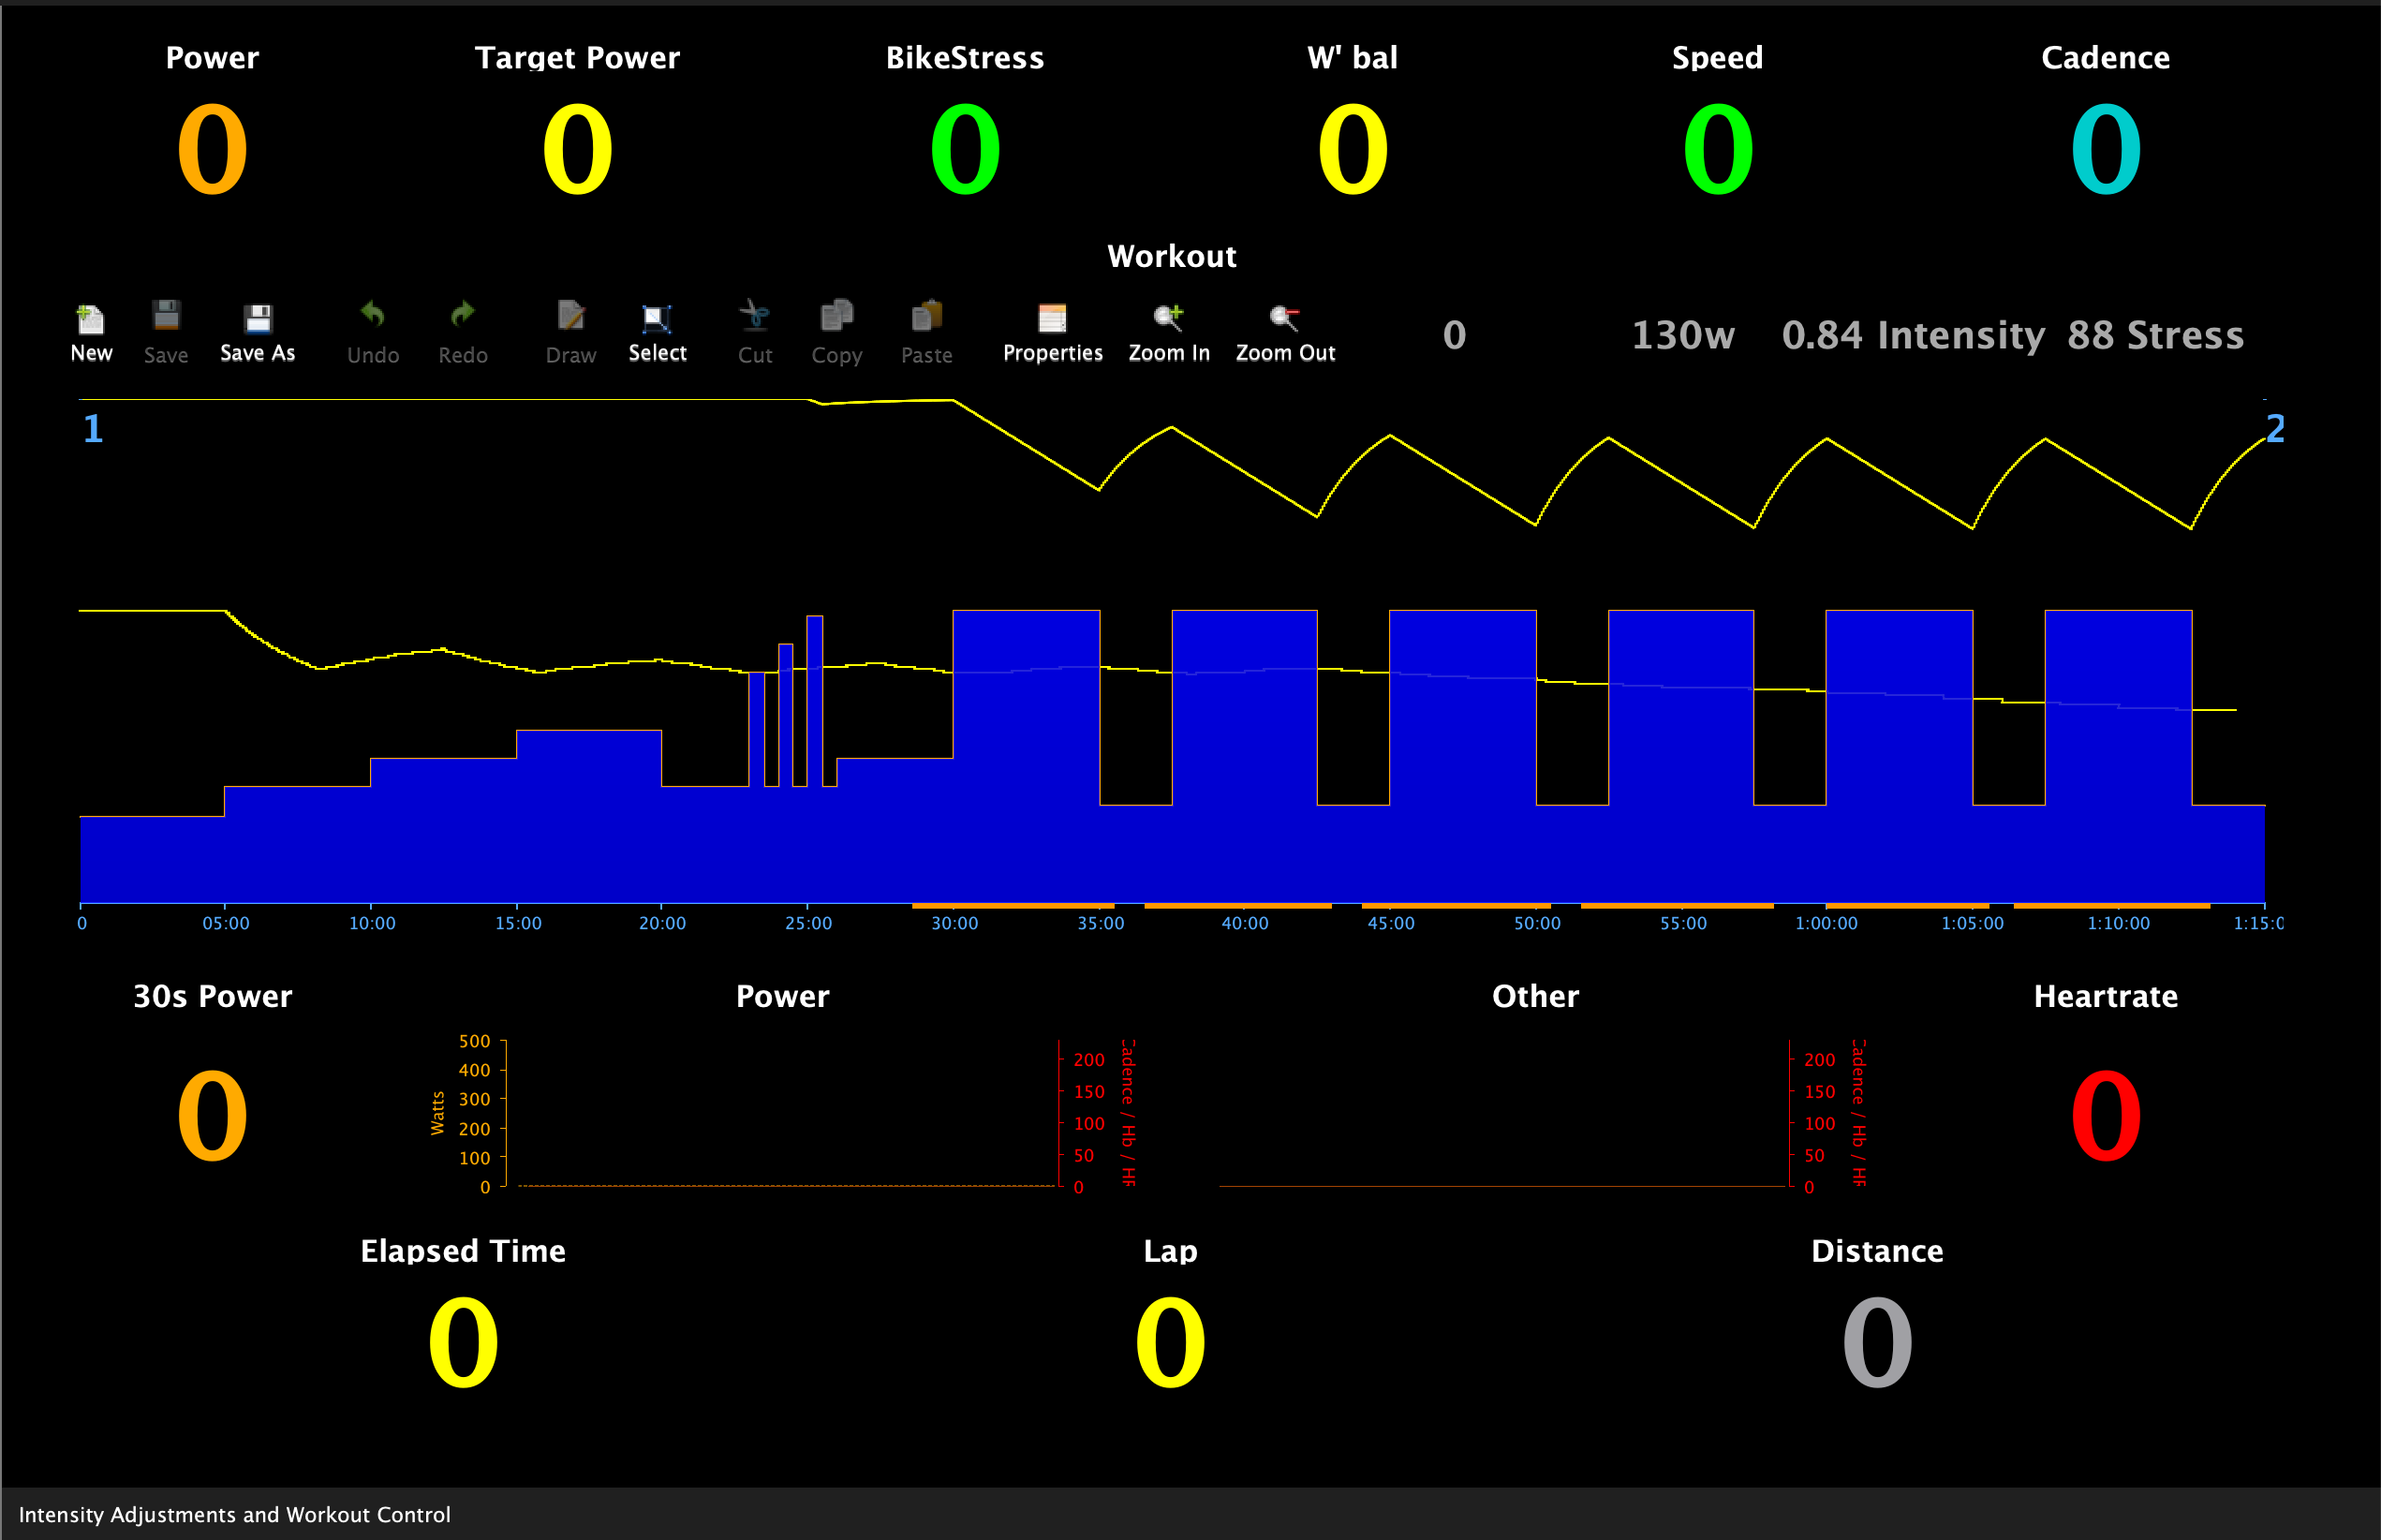
Workout 1 (2x per week): 6 x 5 min @ 105% of CP w/ 2.5 min RBI
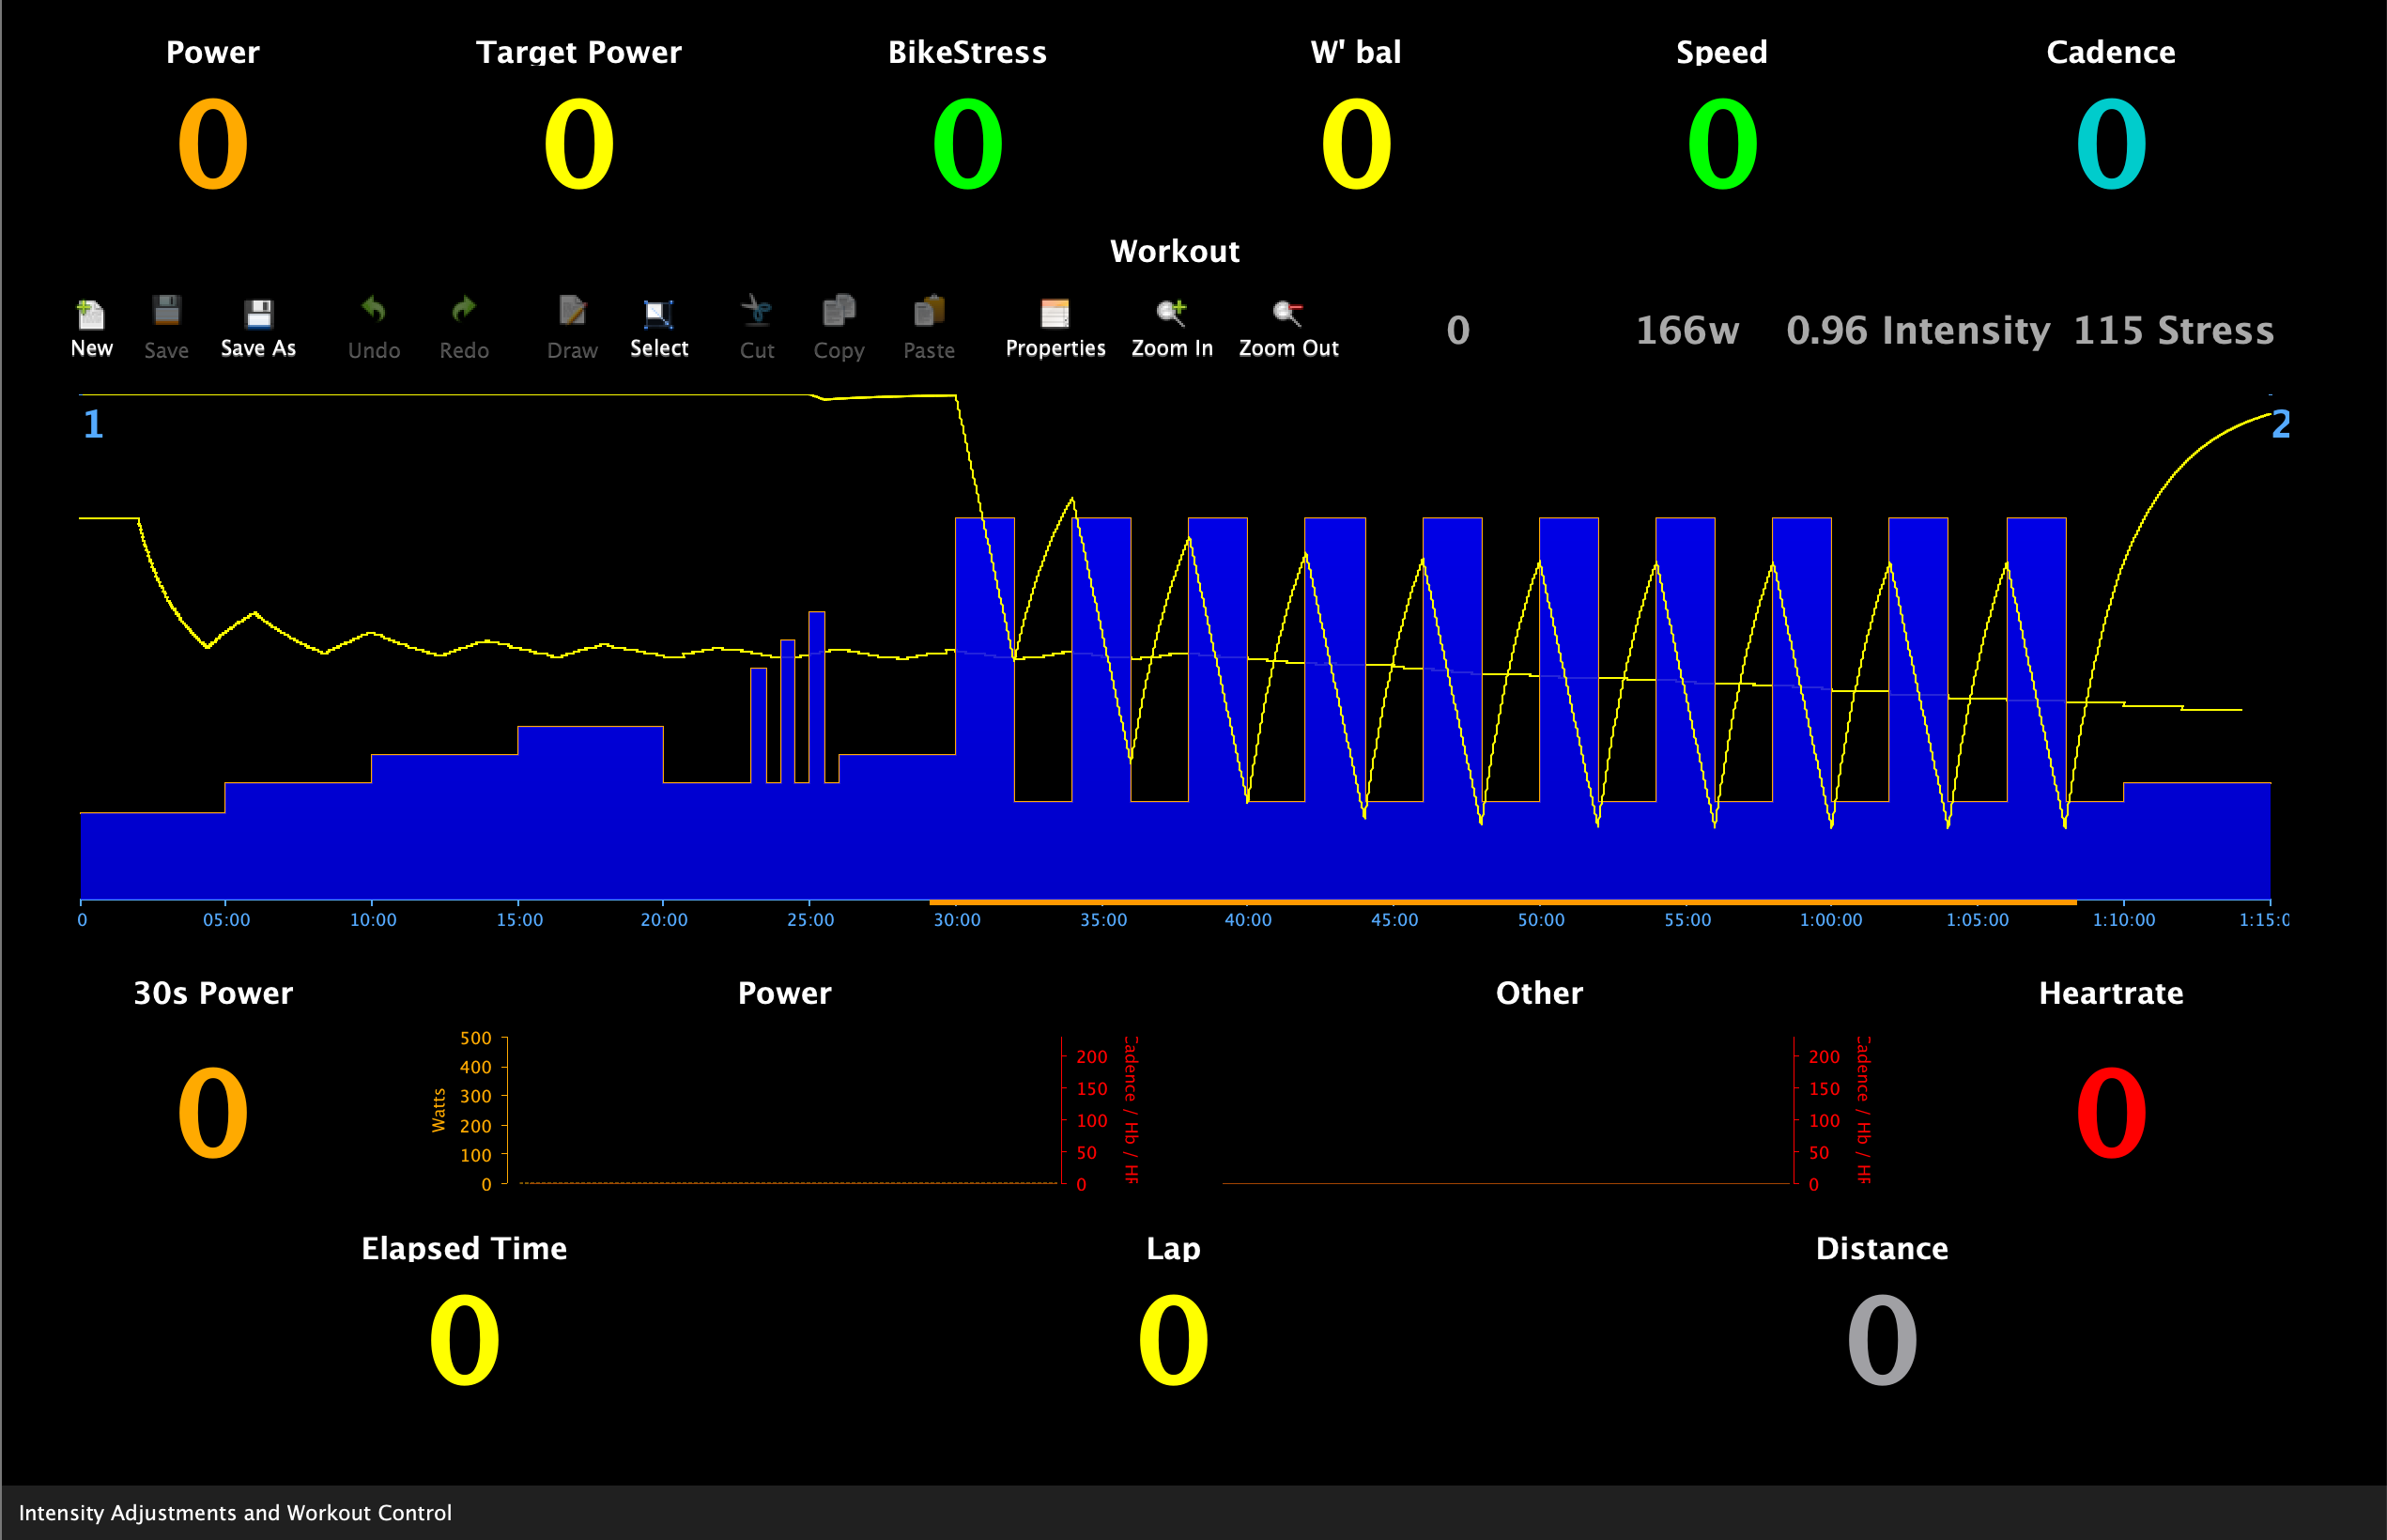
Workout 2 (1x per week): 10 x 2 min @ w/ 2 min RBI. The power for these intervals is calculated as follows: 50% of W’ / 120s + CP. The general idea is to expend 50% of W’ by the end of the first interval. This looks very, very hard.
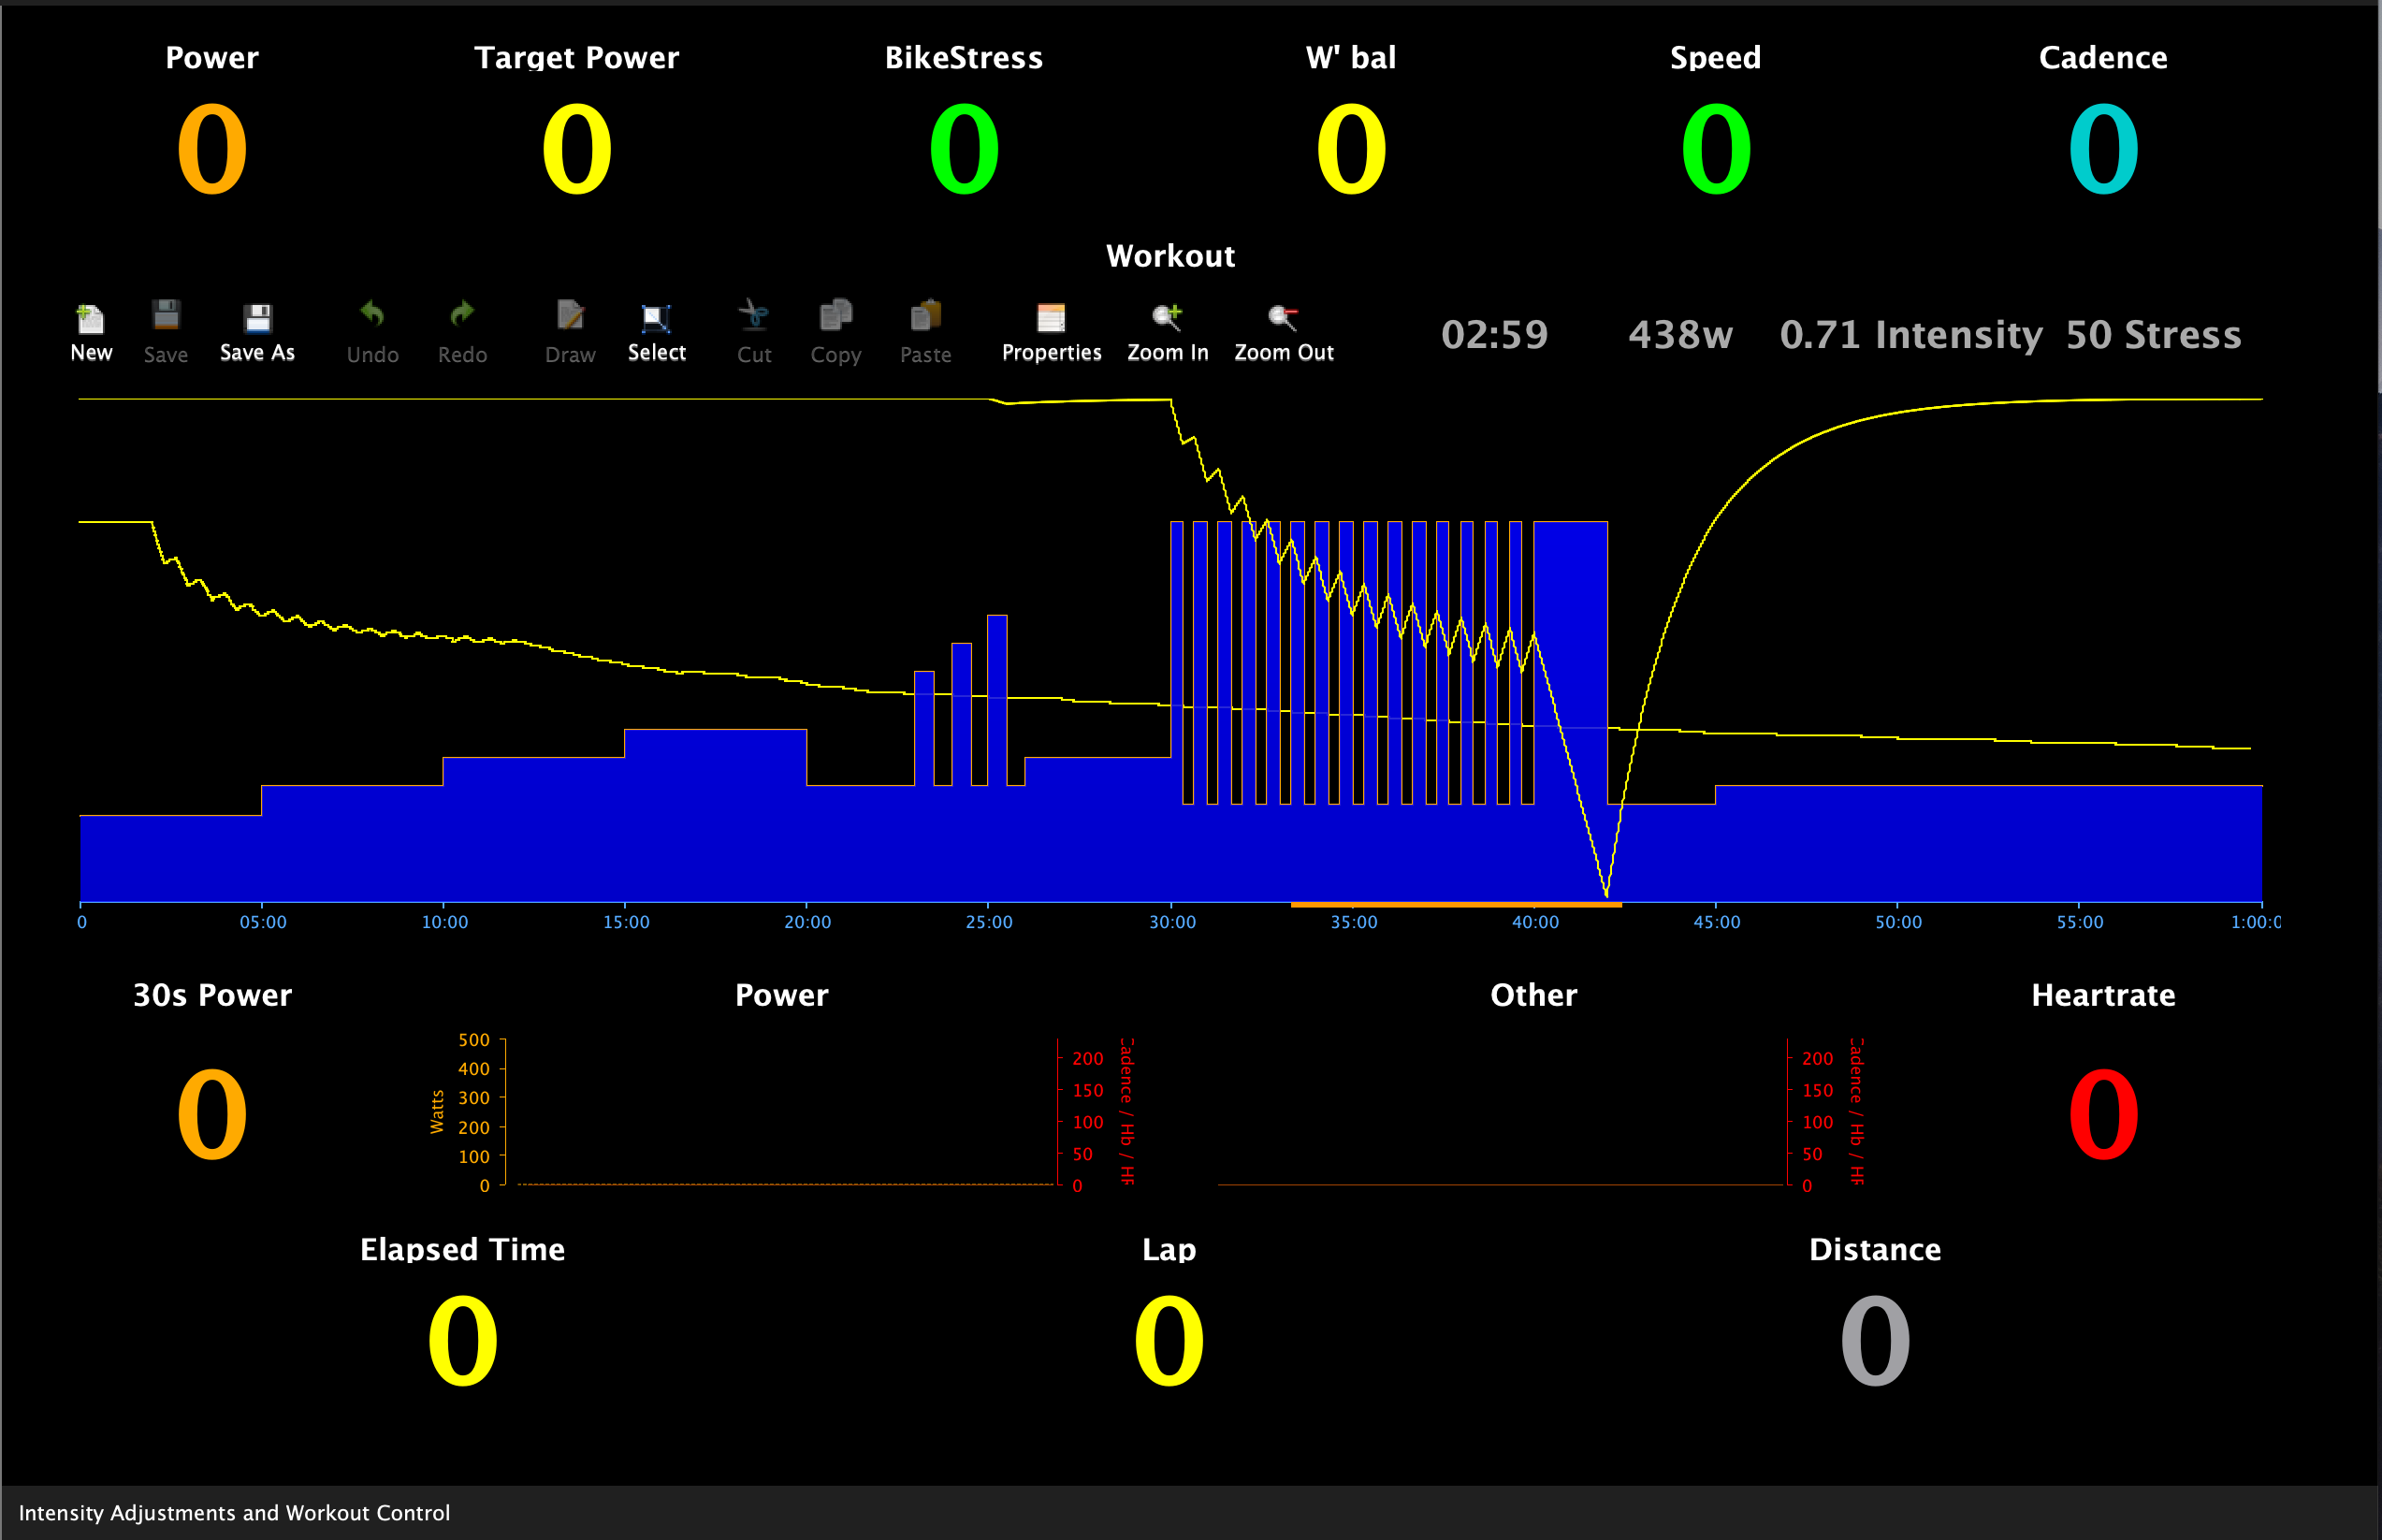
The second protocol is Skiba’s. My read of this article is that his primary focus was on modeling the reconstitution of W’ as he varied both interval and recovery length, but in his book he suggests this protocol can accomplish pretty much the same results as Vanhatalo in six sessions.
My work shows that you can get away with only six sessions if you are willing to do some truly soul-crushing work. Here’s how it works. You do enough intervals at P4 that you drain half yof your battery, then then you do one final, long interval at P4 until you pop. Athletes got a day or two off between each workout (they needed it), and were pretty fried after 2 weeks of this. However, the group saw an improvement of 9% in CP on average, with a similar improvement in VO2 Max (p. 61)
I used 20s on and 20s off because he suggests that my be the sweet spot in the paper. The idea is to do this six times in two weeks.
4 Likes
Very interesting.
Do you use xert?
Have you tried to plan the same in xert?
Yeah I do. For this I used High North’s Critical Power Calculator spreadsheet which takes three-parameters to calculate CP and W’ and used some best for the last several months. Probably not super accurate since some of the data was old, but it resulted in a CP very similar to Xert and WKO’s estimates for threshold. However, HEI in Xert is 3.5 KJ higher than W’ for the three-parameter estimate. This means the workouts would be even harder if I designed them in Xert.
So - long story short, I took the easier way out. Looking at Golden Cheetah now, CP and W’ have changed based on some testing over the weekend so I’d have to revise with the new parameters and see how they compare. Will get to this and report back.

1 Like
Here they are.
Workout 2 from Vanhatalo and the Skiba workout were created using 4 MMP for the intervals. I just used 20 MMP as a proxy for 105% of CP for Workout 1 from Vanhatalo.
I was a bit confused because in Xert you have spent all of HEI when the purple line hits the interval power, wheres in the critical power model you have spent all of W’ when it meets the x-axis (zero). So - in practice the two workout are not super different based on the CP and W’ estimates from the High North Calculator.
3 Likes
Not exactly since you can’t use up all your HIE in Xert. The Xert model should work better at identifying your power curve since it acknowledges, mathematically, that at the end of a maximal effort, you’re not empty of capacity. You just can’t sustain the target work rate and can only perform below that (below MPA in other words). Using Xert to analyze your data reveals this to be true, i.e. you often produce power above TP after you reach a point of failure.
Notably, the W’bal calculation will always go below zero when this happens suggesting that CP/W’ have not be calculated correctly but in reality W’bal will always go negative if it’s based on maximal constant efforts to failure since it presumes W’bal is 0 when this happens. In reality you have some residual capacity left when W’bal is 0 and thus will often go below 0 even when CP/W’ are calculated correctly.
1 Like
Welcome, Armando! I realized this after creating the workouts in Xert. I have found your software’s modeling to be exceptional.
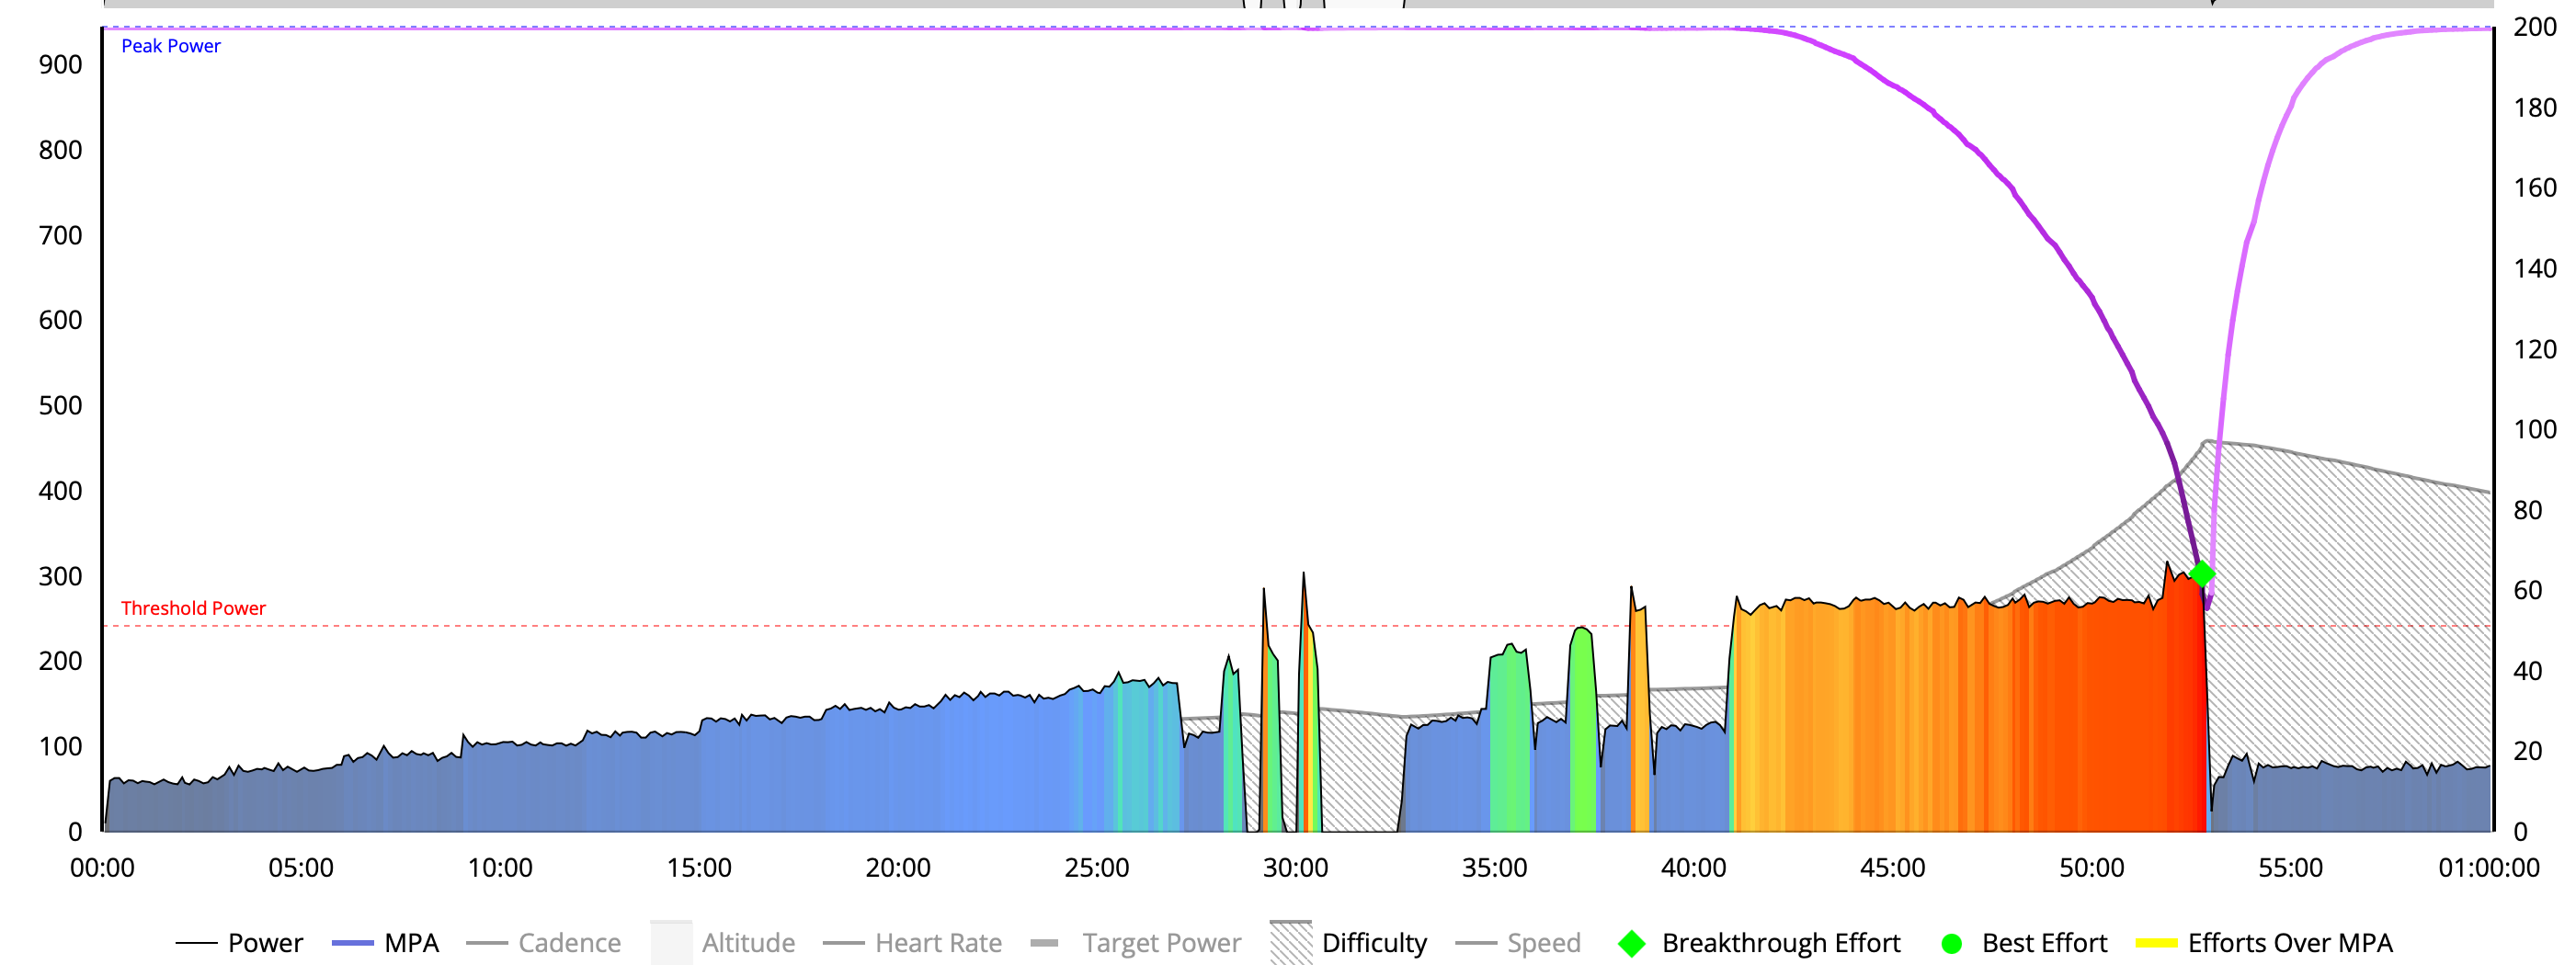
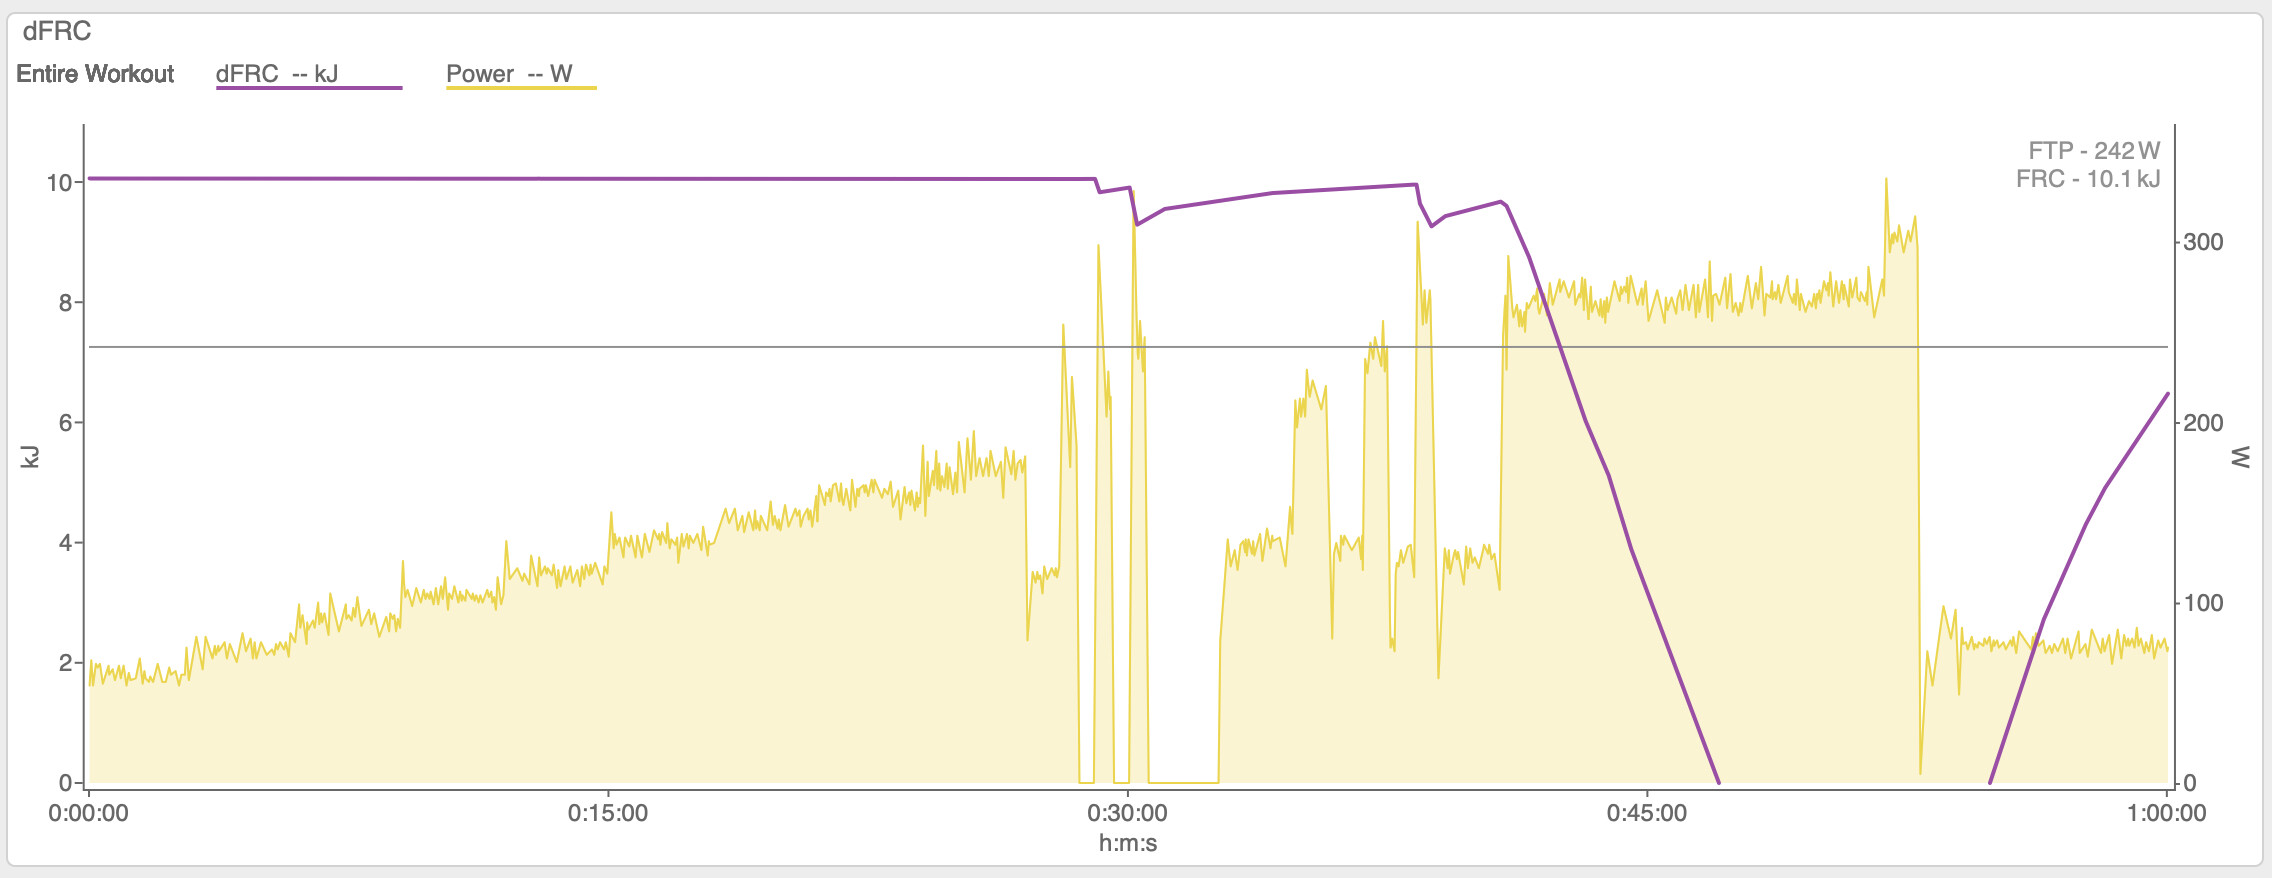
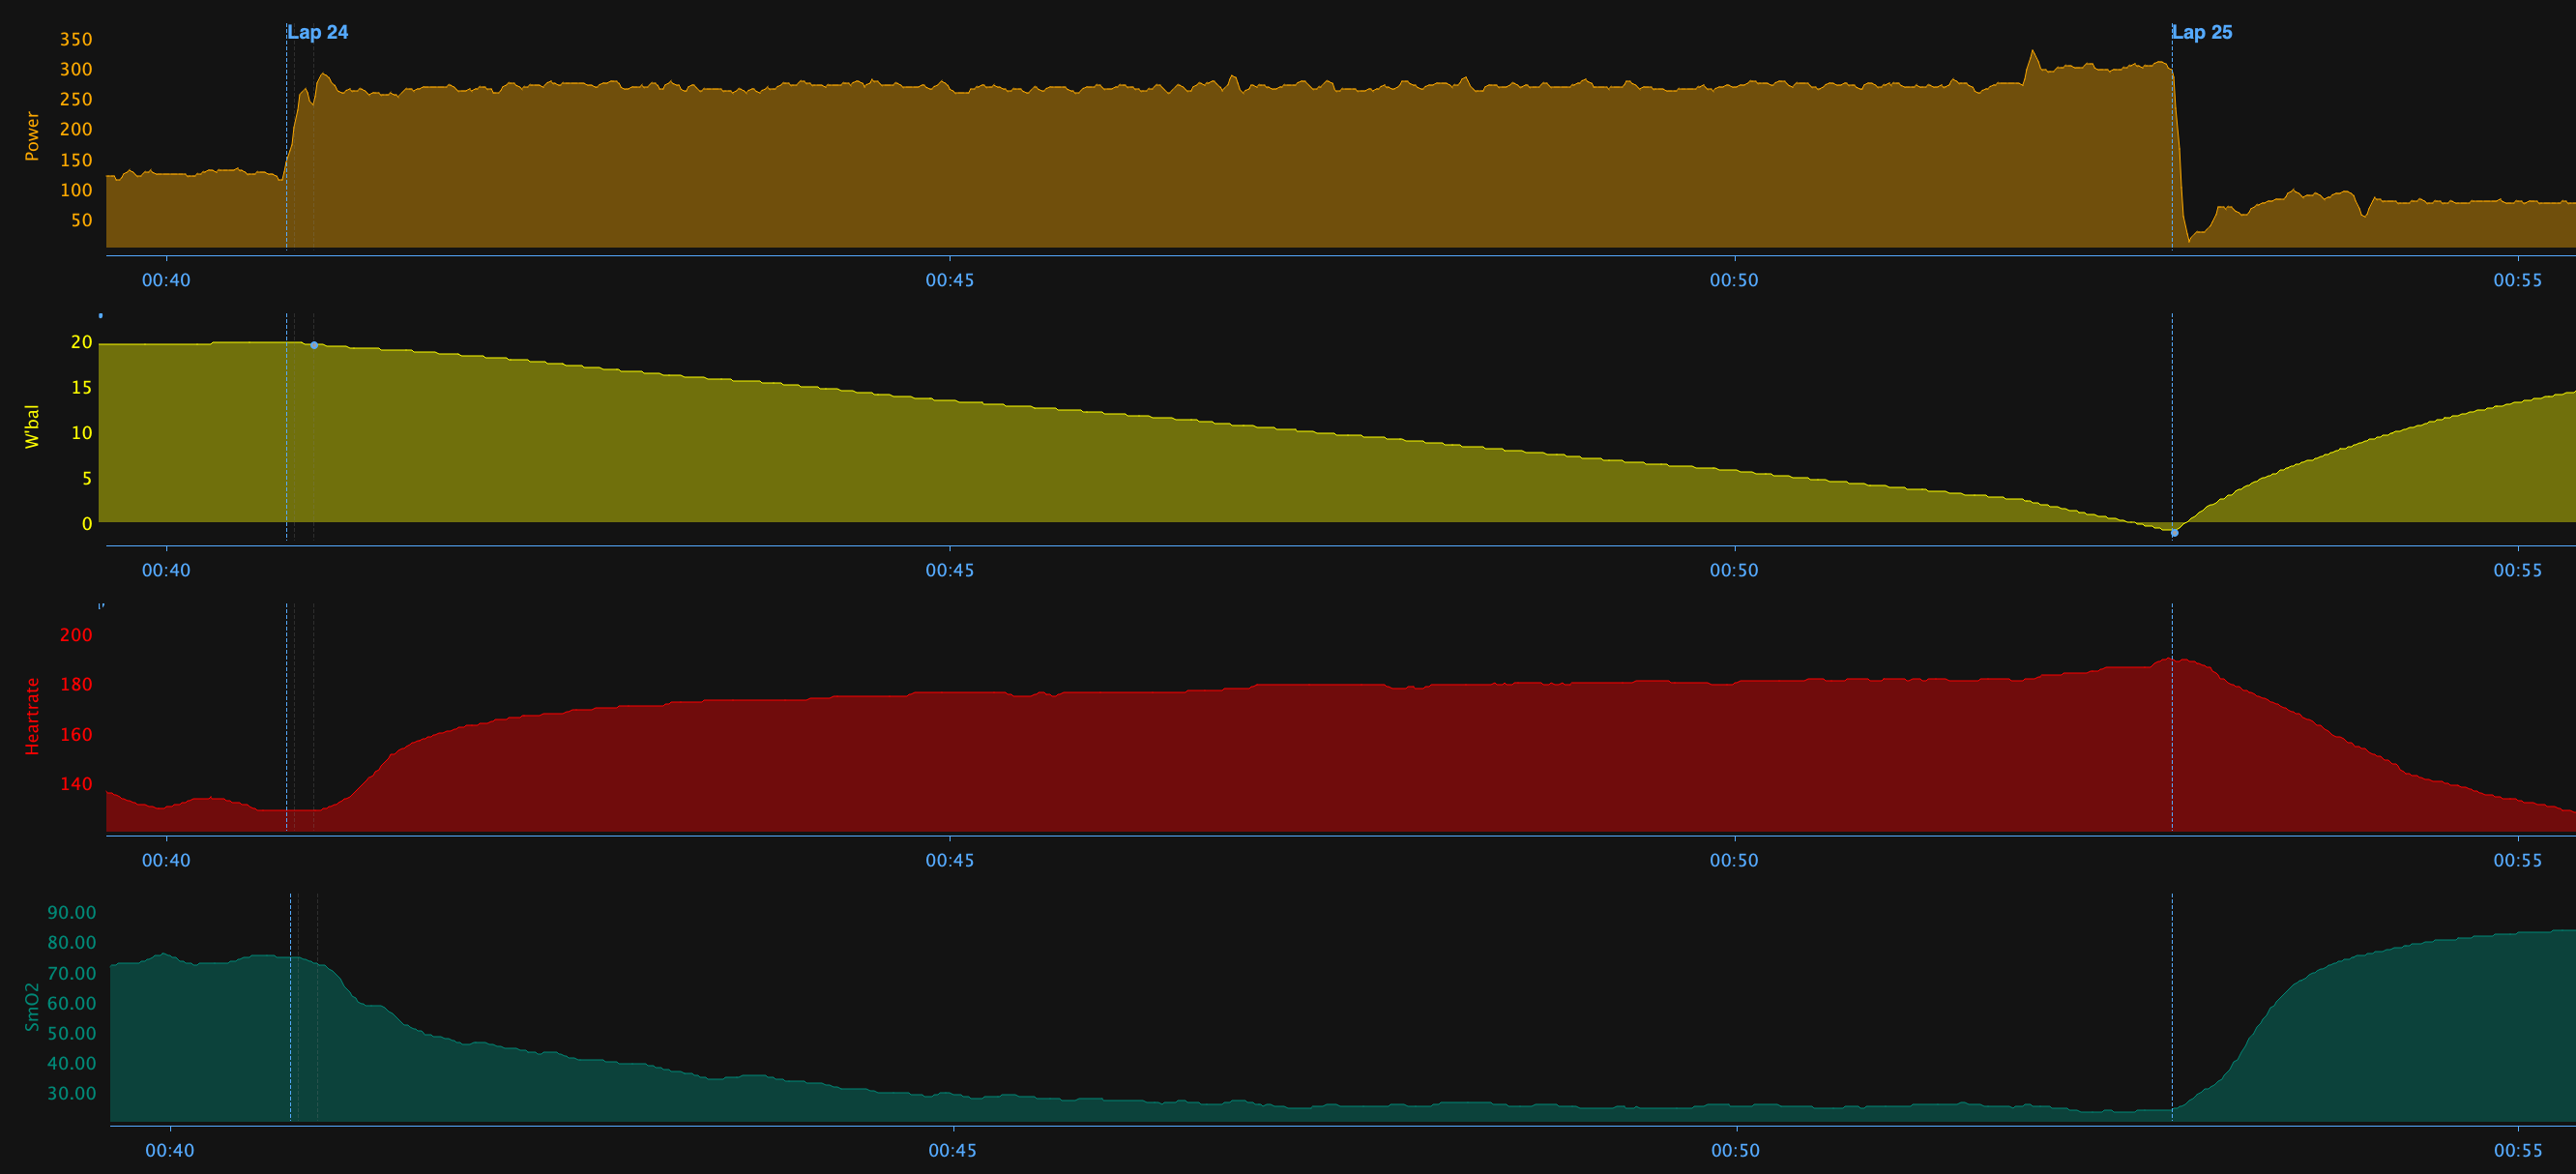
Your second paragraph is interesting. I have noticed these differences between HIE in the Xert model, FRC in WKO (MMP) and W’ in Golden Cheetah (CP). I did a 12 min effort on Saturday. This is how that looks for the three pieces of software.
Xert
WKO
And GC (notably, this is using the CP and W’ I calculated using the three parameter model, so it is much closer than WKO).
I don’t know much about WKO’s modeling of FRC. But in my case, it is always way less than W’ and HIE.
1 Like
If rather than stopping when your MPA came down to reach power, you kept going below your 12 minute MMP, W’bal would have gone even further below 0. W’bal doesn’t model your capacity after you reach failure and continue. It presumes you can’t. Watch for some new research to get published on this.
2 Likes
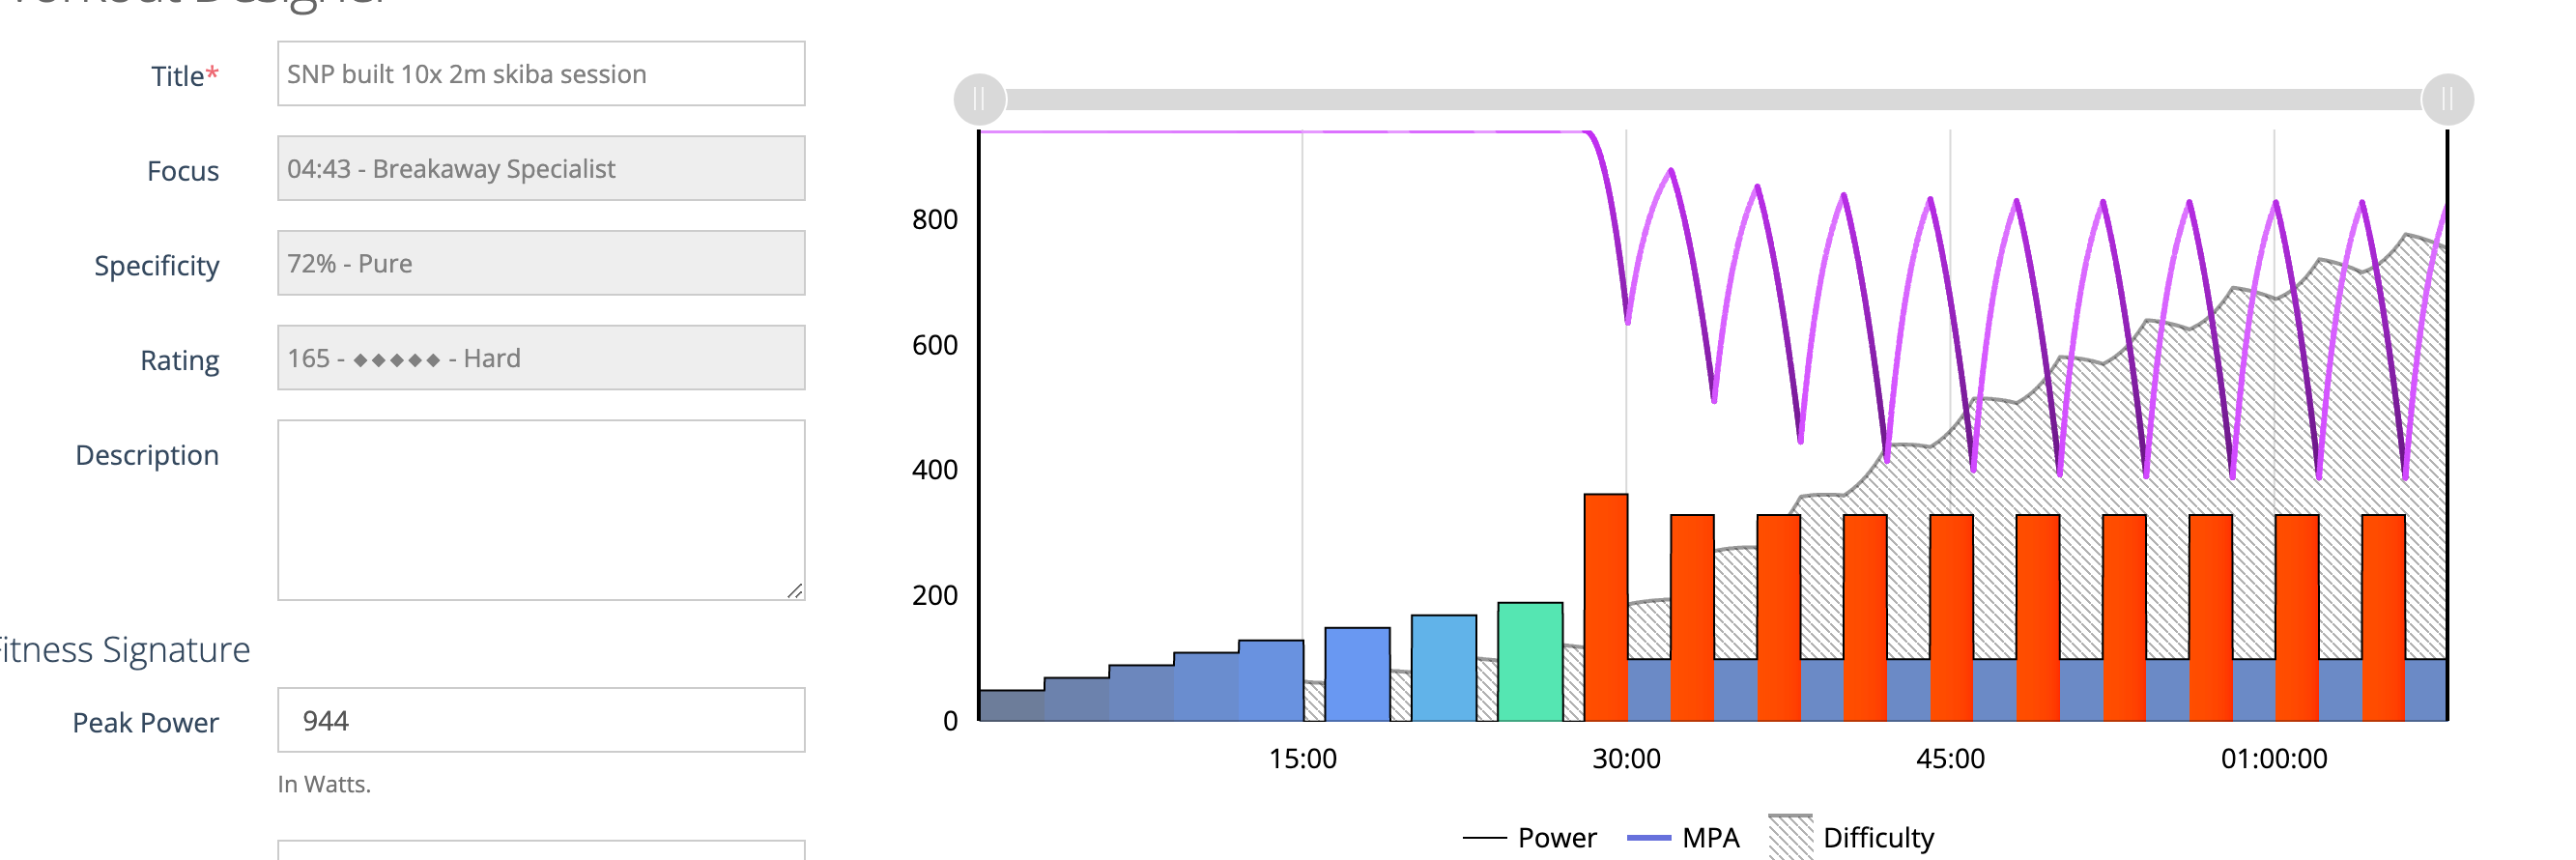
@fazel1010 @mastracci
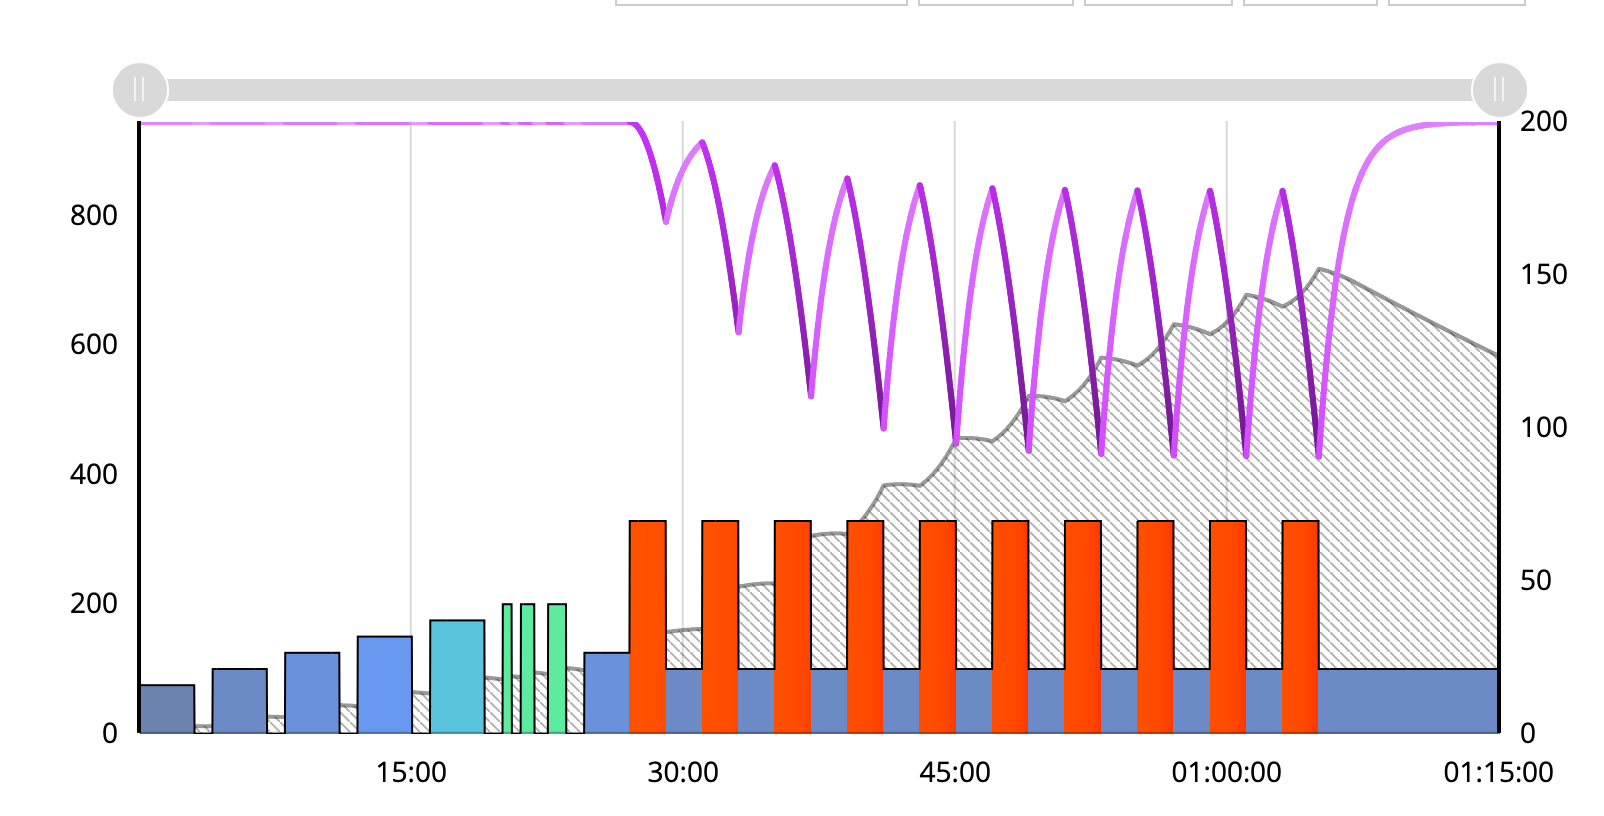
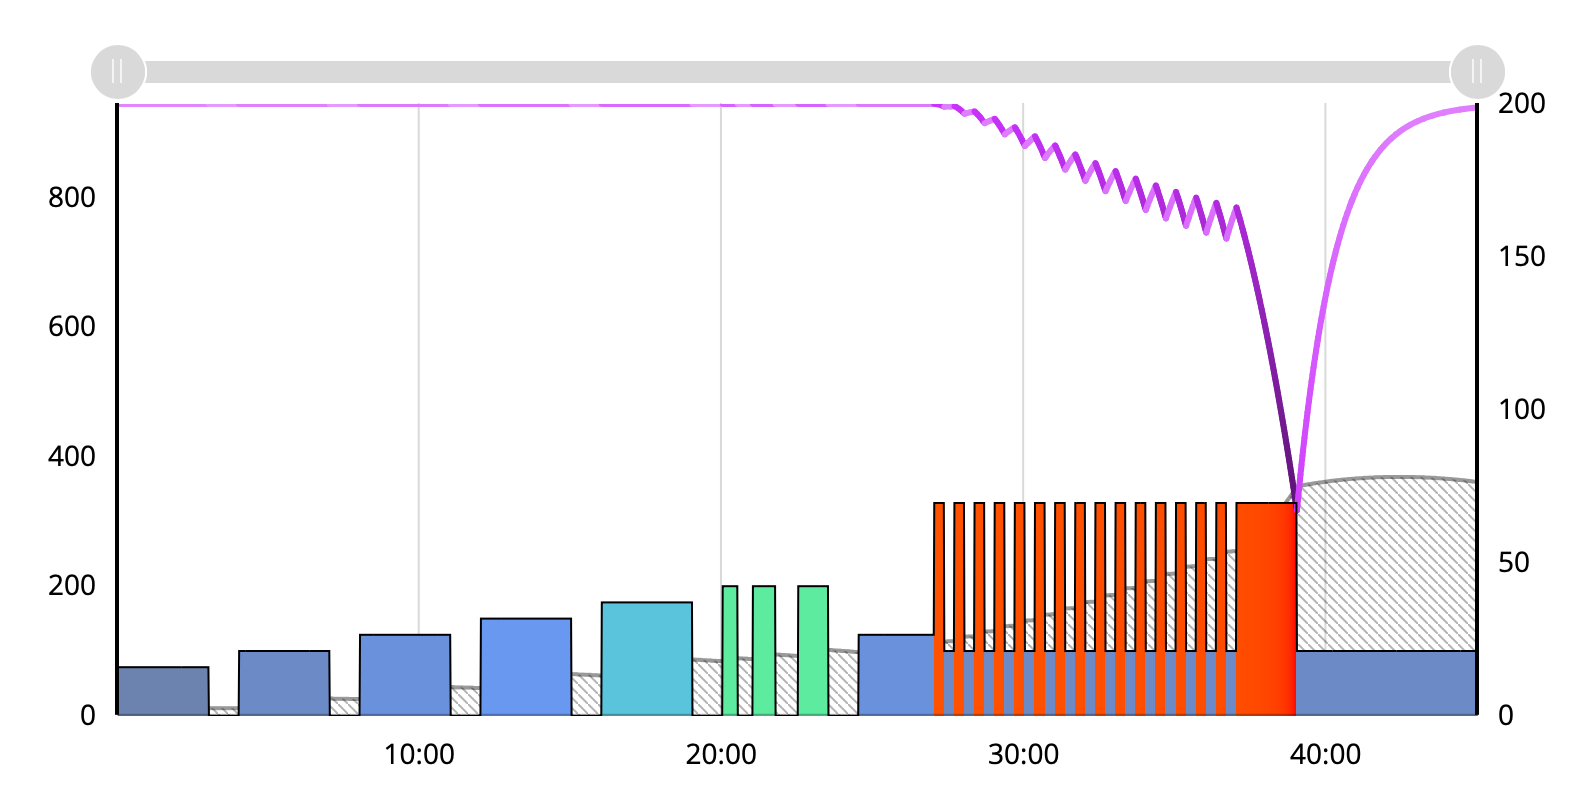
If I were to build that session for you in xert it would look like this.
A little deeper than you built above, trying to get the mpa lower (50% between mpa and power) on that first interval.
Steve
Hi @steveneal - did you forget the attachment?
@fazel1010 sorry put in other thread…losing my mind
here it is
3 Likes