Great information here Steve and appreciate the help. The training I’ve been doing to increase the LBP has made great improvements in my riding over the past two months. Great stuff here.
1 Like
I’d love to know where LTP as modeled by Xert compares to LT1 for those that have good numbers and use both. @steveneal should have good data I think. I have a meter and strips, but testing solo on rollers is a PIA. Thanks!
@fazel1010 hi Andrew nice to see you on here!
I know you are familiar with my balance point concept so I will try me best here.
The quick answer is less than half the time or maybe even more.
The real reason is due to the fact that the variation between LT1 - Lactate Balance Point - LT2 make it challenging for software like XERT to be accurate at least at this point.
You could have two athletes with LT1 of 200w and LT 2 of 300w so the same in these levels. Now one athlete could have lactate balance point of 215 and the other 245 watts. Both of those are very regular scenarios (the 215 more than the 245).
In the case of the athlete with the LT1 and LBP that are close together 200 and 215 XERT will be closer. For the other athlete it will be off.
So again it isn’t really close enough to rely on foe most.
I would say thy foe your rollers I would always just suggest ling 8m pieces taking a lactate at the end of each piece.
Start by riding for 10-15m at 150w then move to 8m pieces and try this.
170w
180w
190w
200w
210w
220w and so on.
This means less time between lactated. Also means that you have a good 6-8m for lactate to stabilize after you stop and take your lactate.
1 Like
Thanks, @steveneal! I have spent the last eight months doing triathlon training, but am happily now returning to a bike focus and find myself revisiting your philosophy (as I understand it).
I will try this protocol. I did 10 min steps at the end of May but the data was hard for me to interpret. I think one of the readings was off. Image attached…
@fazel1010 hello
Should be back in computer this Friday to have a better look.
Just travelling so only decent internet every 3 or 4 days.
Back soon.
No worries. I think it was an optimistic interpretation anyway. I think this one is more reasonable. Stay safe!
@fazel1010 ok…got a new computer! hard to work on a phone.
Can you please send me the fit file that goes with this test, as well as the lactates and the time they were taken at.
Then I can put it in my software.
Thanks.
Steve
Sure - how do I send a file? It looks like the forum and messages only allow image formats? Thanks!
This is done. Thanks so much!
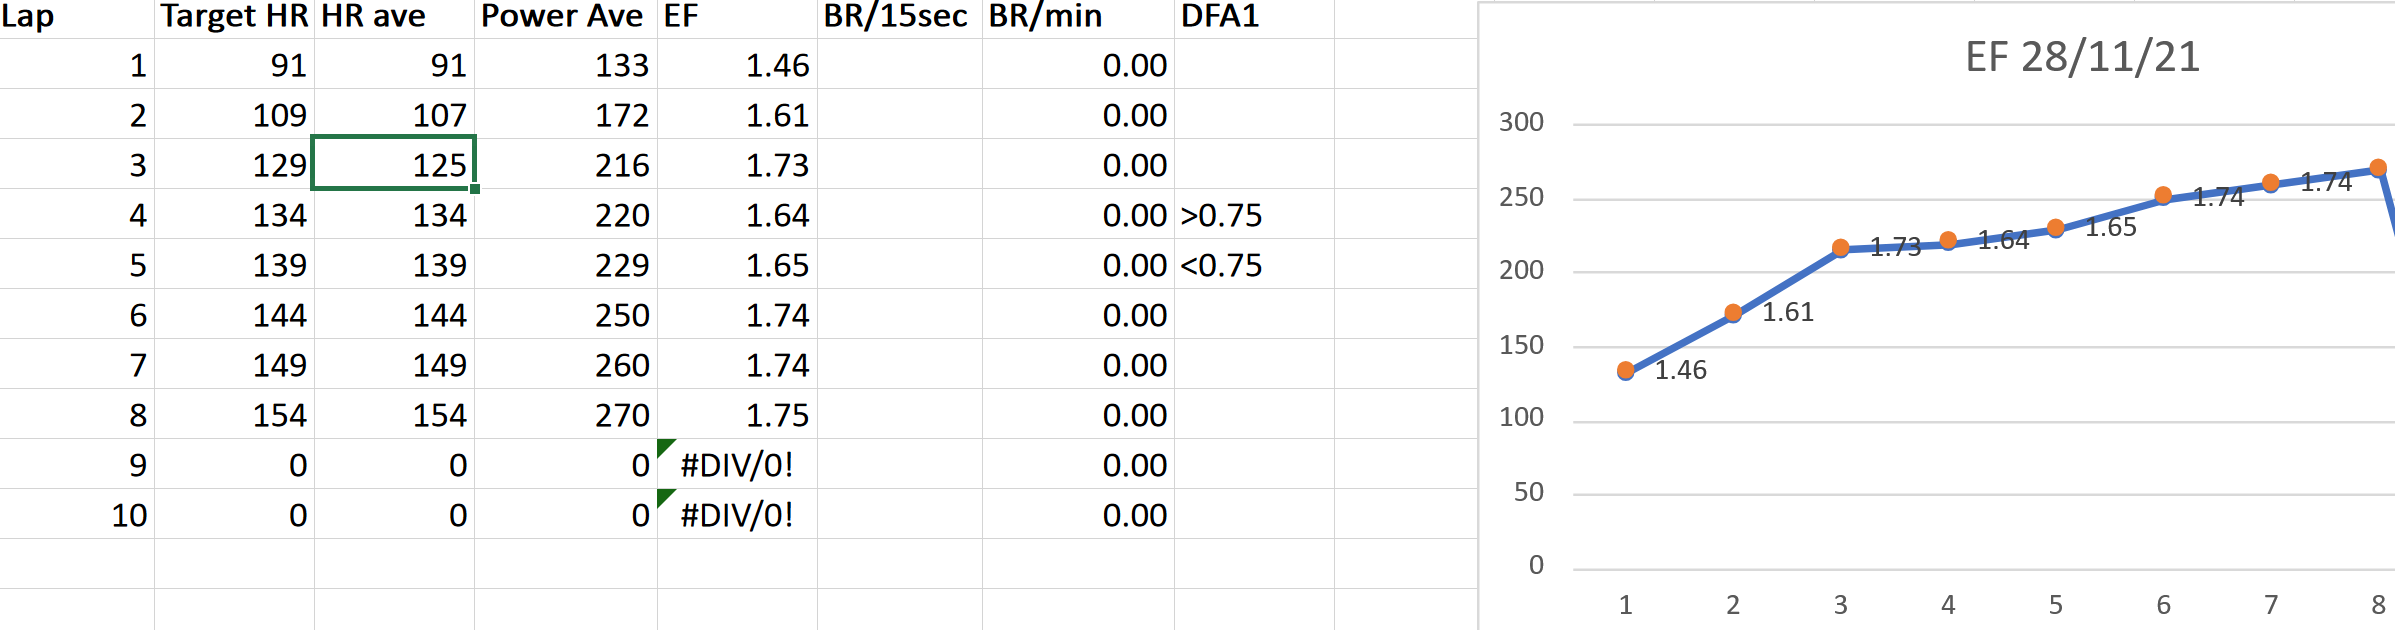
@steveneal I did the step test again todayto compare to the one from May. My fitness will have dropped off a bit since May and the EF figures are lower as expected. The point where it begins to level out is actually very similar though - EF 1.77 @212W in May and EF 1.73 @216W today.
Not really sure what this indicates but thought it was an interesting observation
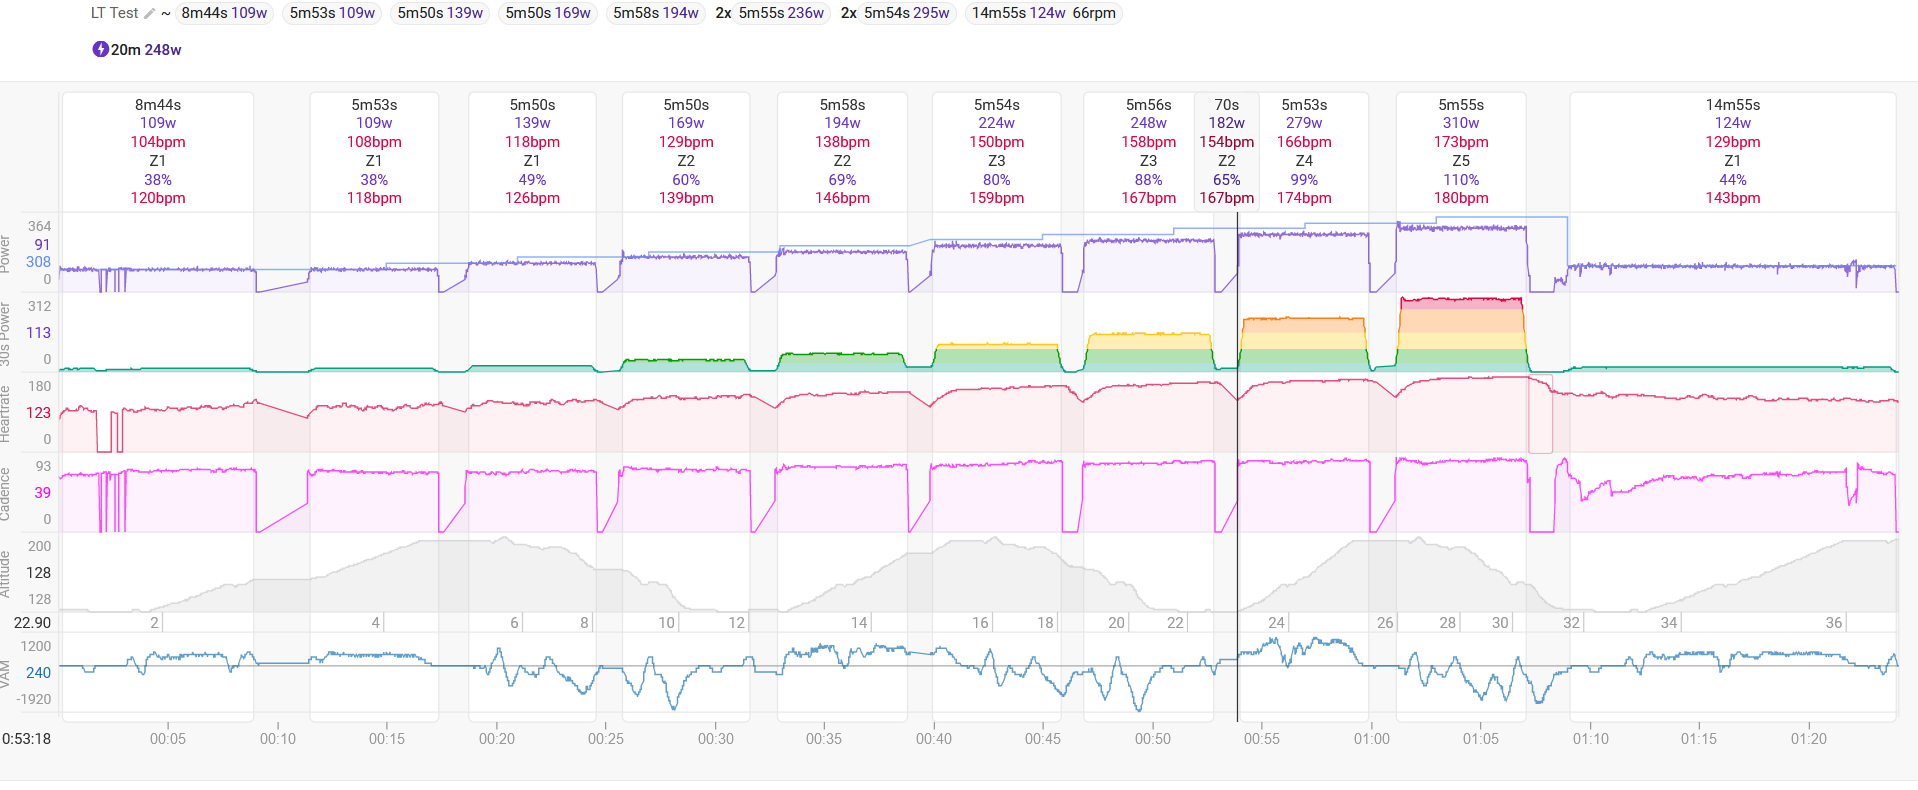
Decided to do my own test today since I recently bought a lactate meter (lactate plus) and wanted to see how it compared to a test I did last year where my old coach put my lactate threshold 1 hr at 140bpm.
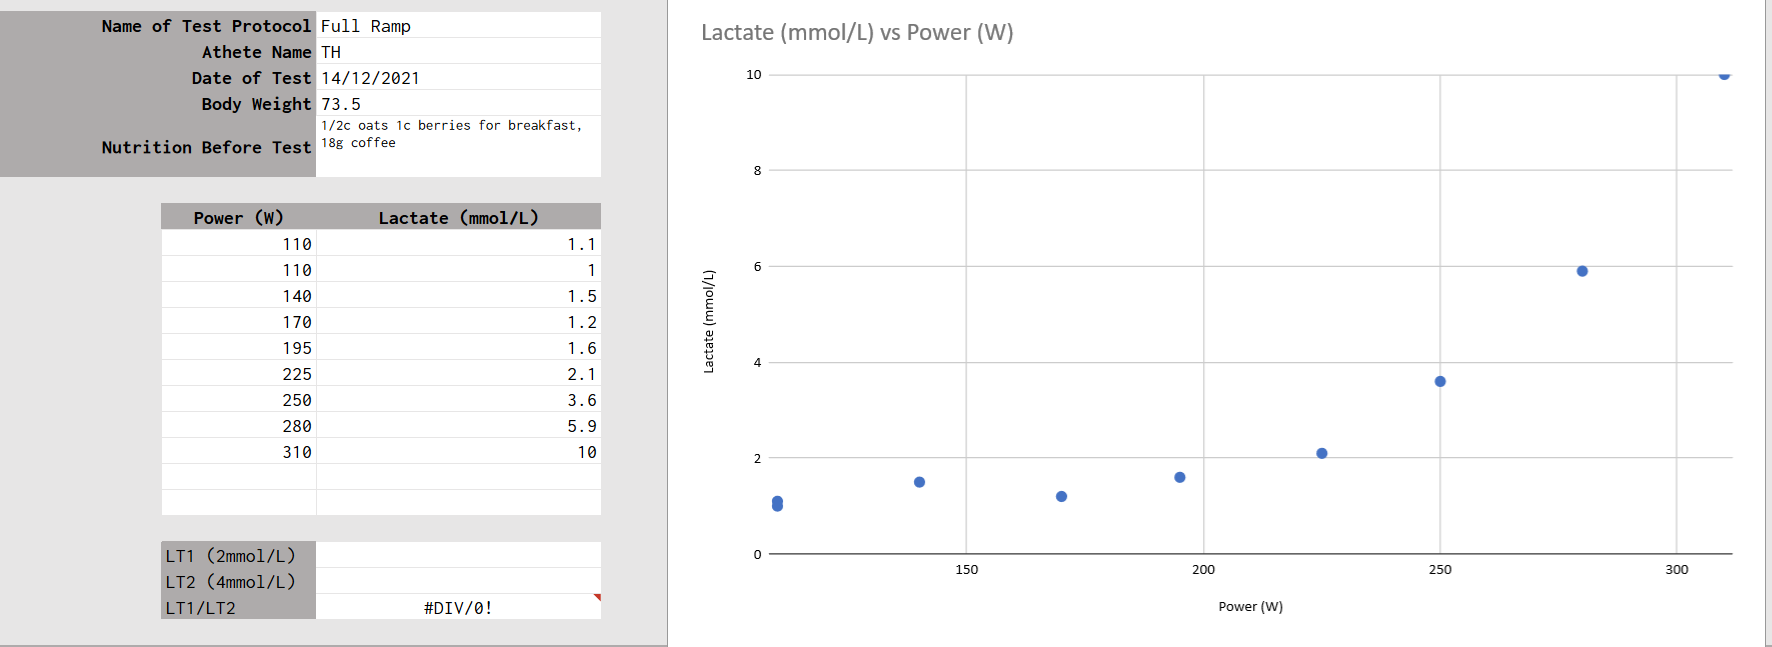
I think the reading at 170w was an error but hopefully the rest is accurate.
For the test I took samples at 8 minutes into a 15 minute warmup at 40% estimated threshold and at the end of the warmup. I then paused at the end of each 6 minute block to quickly test. Not really sure where to put the lt1/2 turn points but interested to see what anyone thinks.
@steveneal
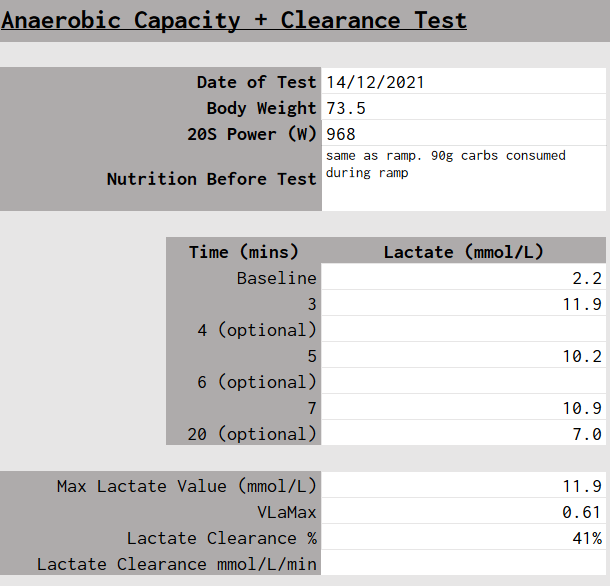
Also did a quick clearance test before I start properly training again.
It looks like I missed this one sorry
do you have a fit file that goes with the lactate step test data.
also in the vlamax test you show 11.9 as max value but you don’t show where that is in the spreadsheet, did you go from 7m to 20m without taking another lactate and just created a curve?
Ill email you the fit file for them, for the vlamax ill probably retest, like you say it needs more data points. But how I went about it was to warm up for 15 minutes then rest until I saw <2mmol, did an all out 20s effort and then took those at 3 5 and 7 minutes following the 20s effort.
Here is a screenshot of the data as well if people want to see a rough plot of the work.
Hello,
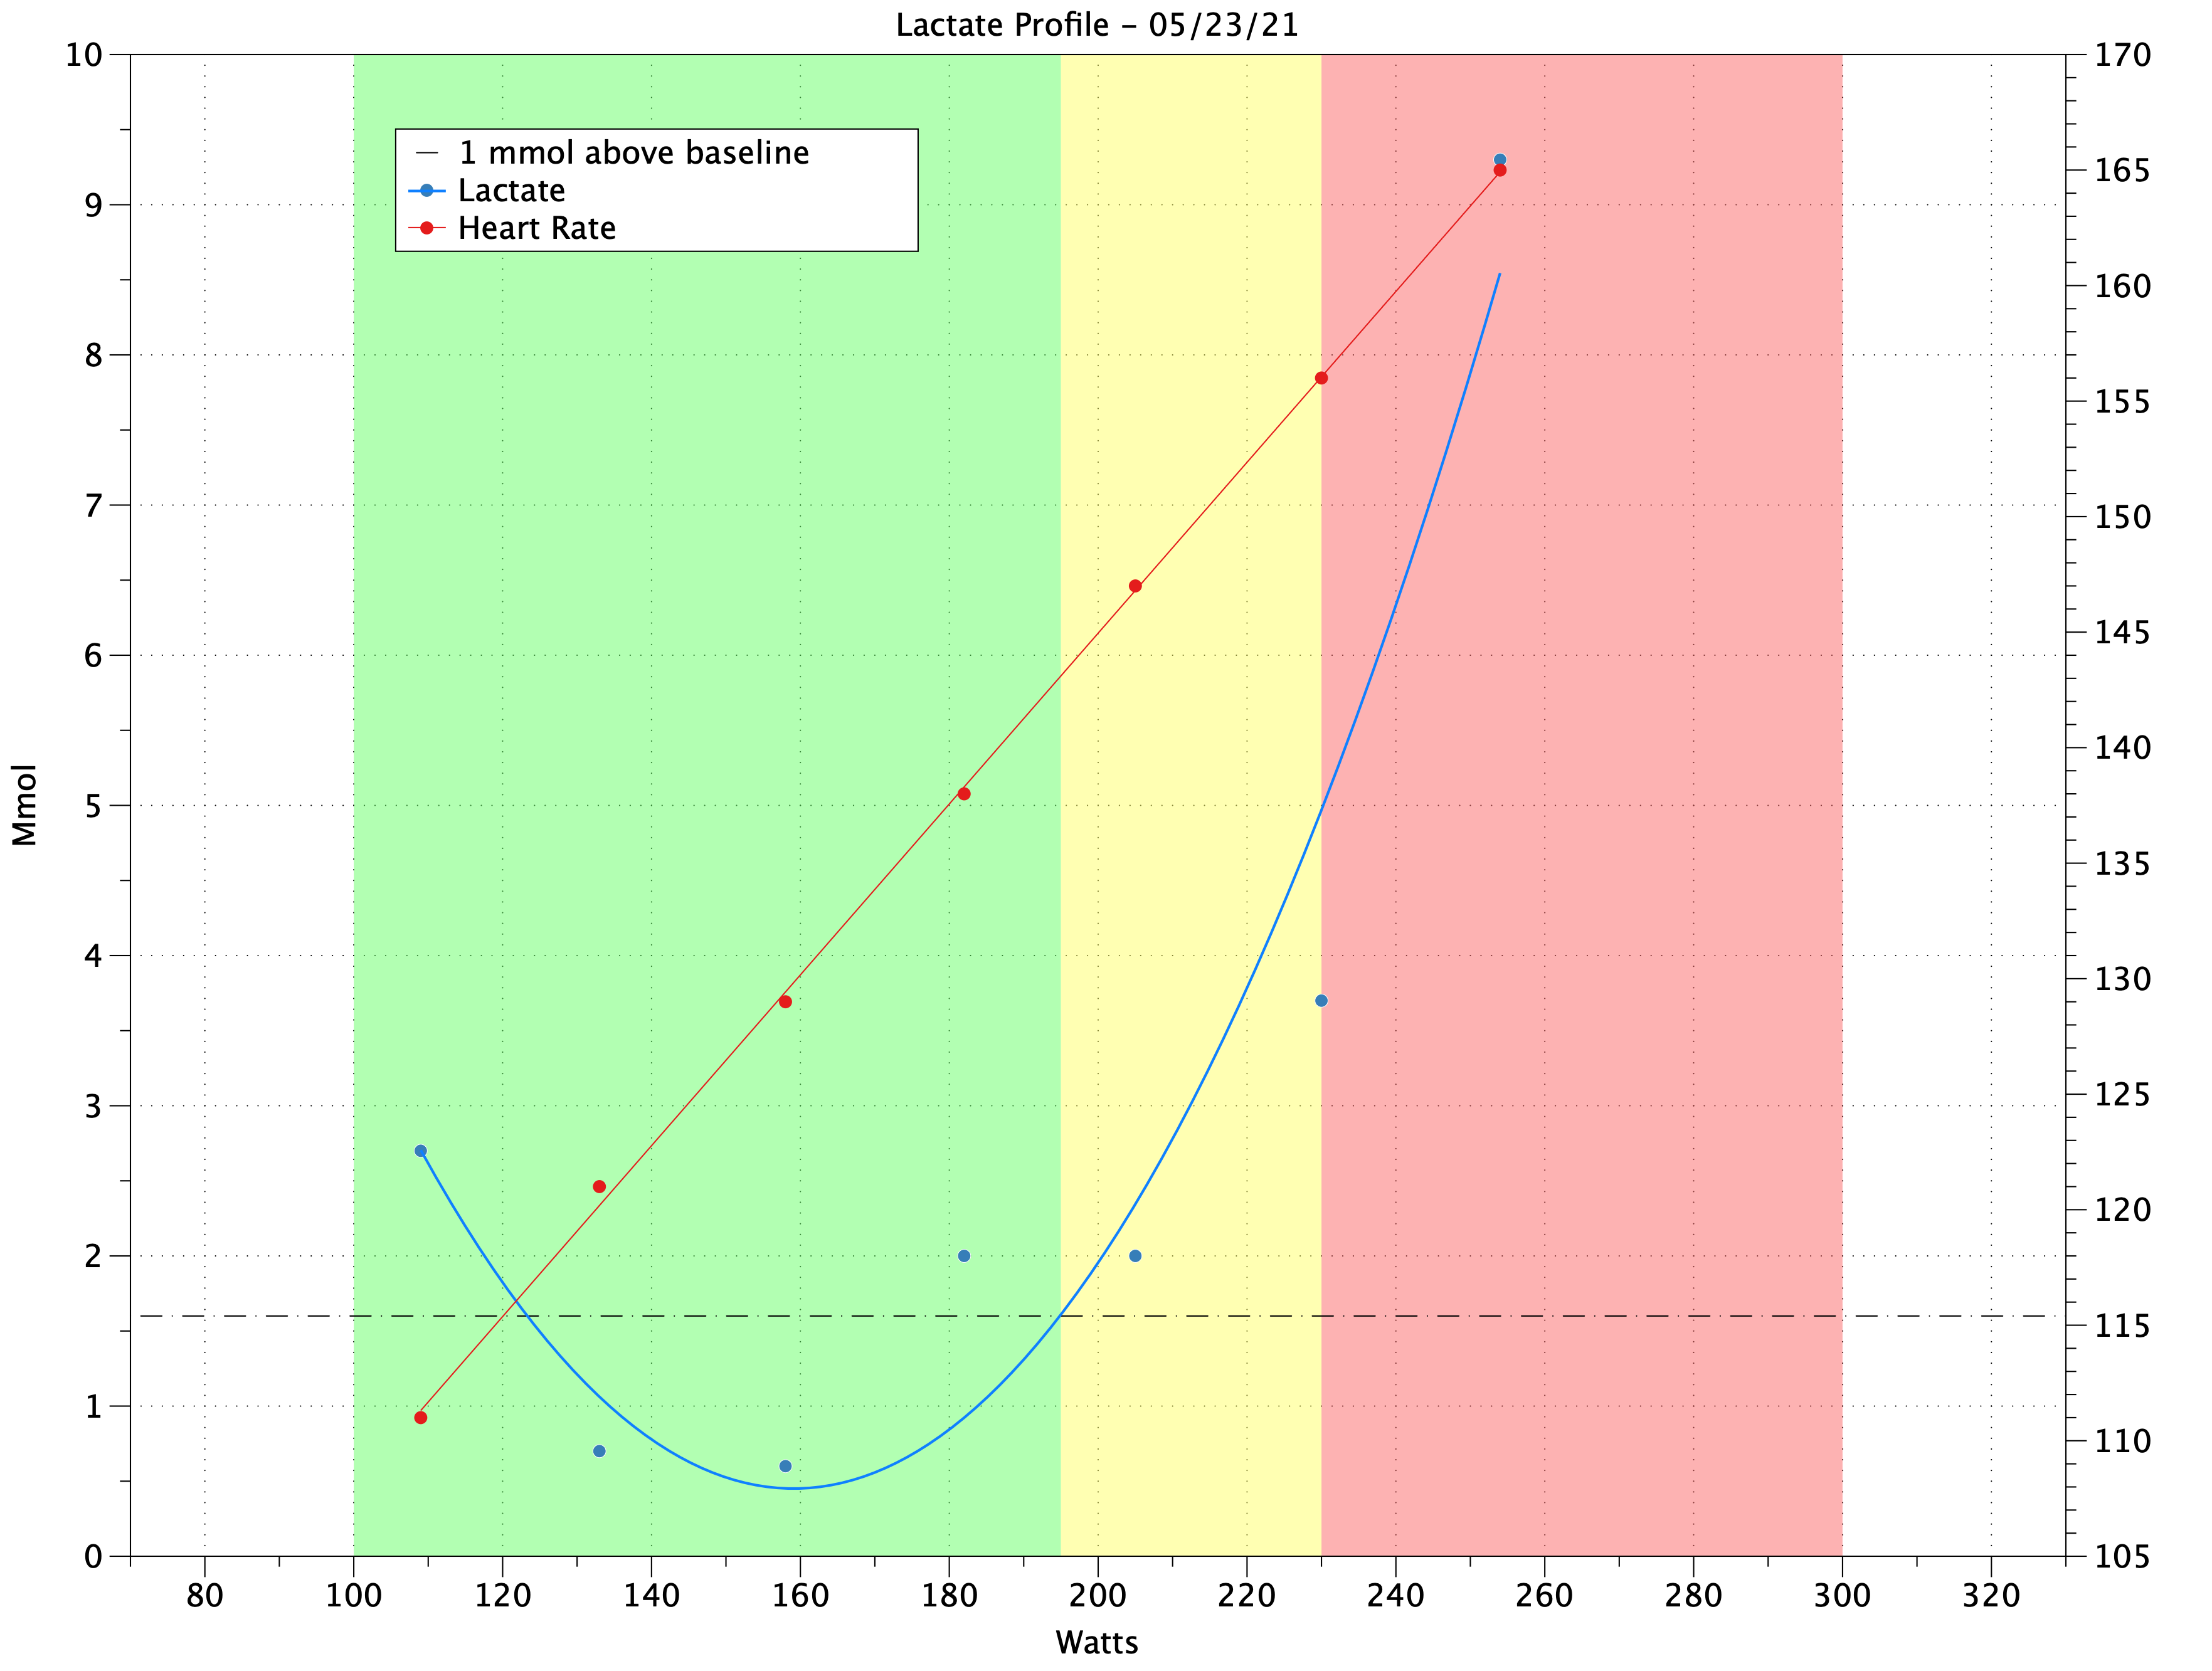
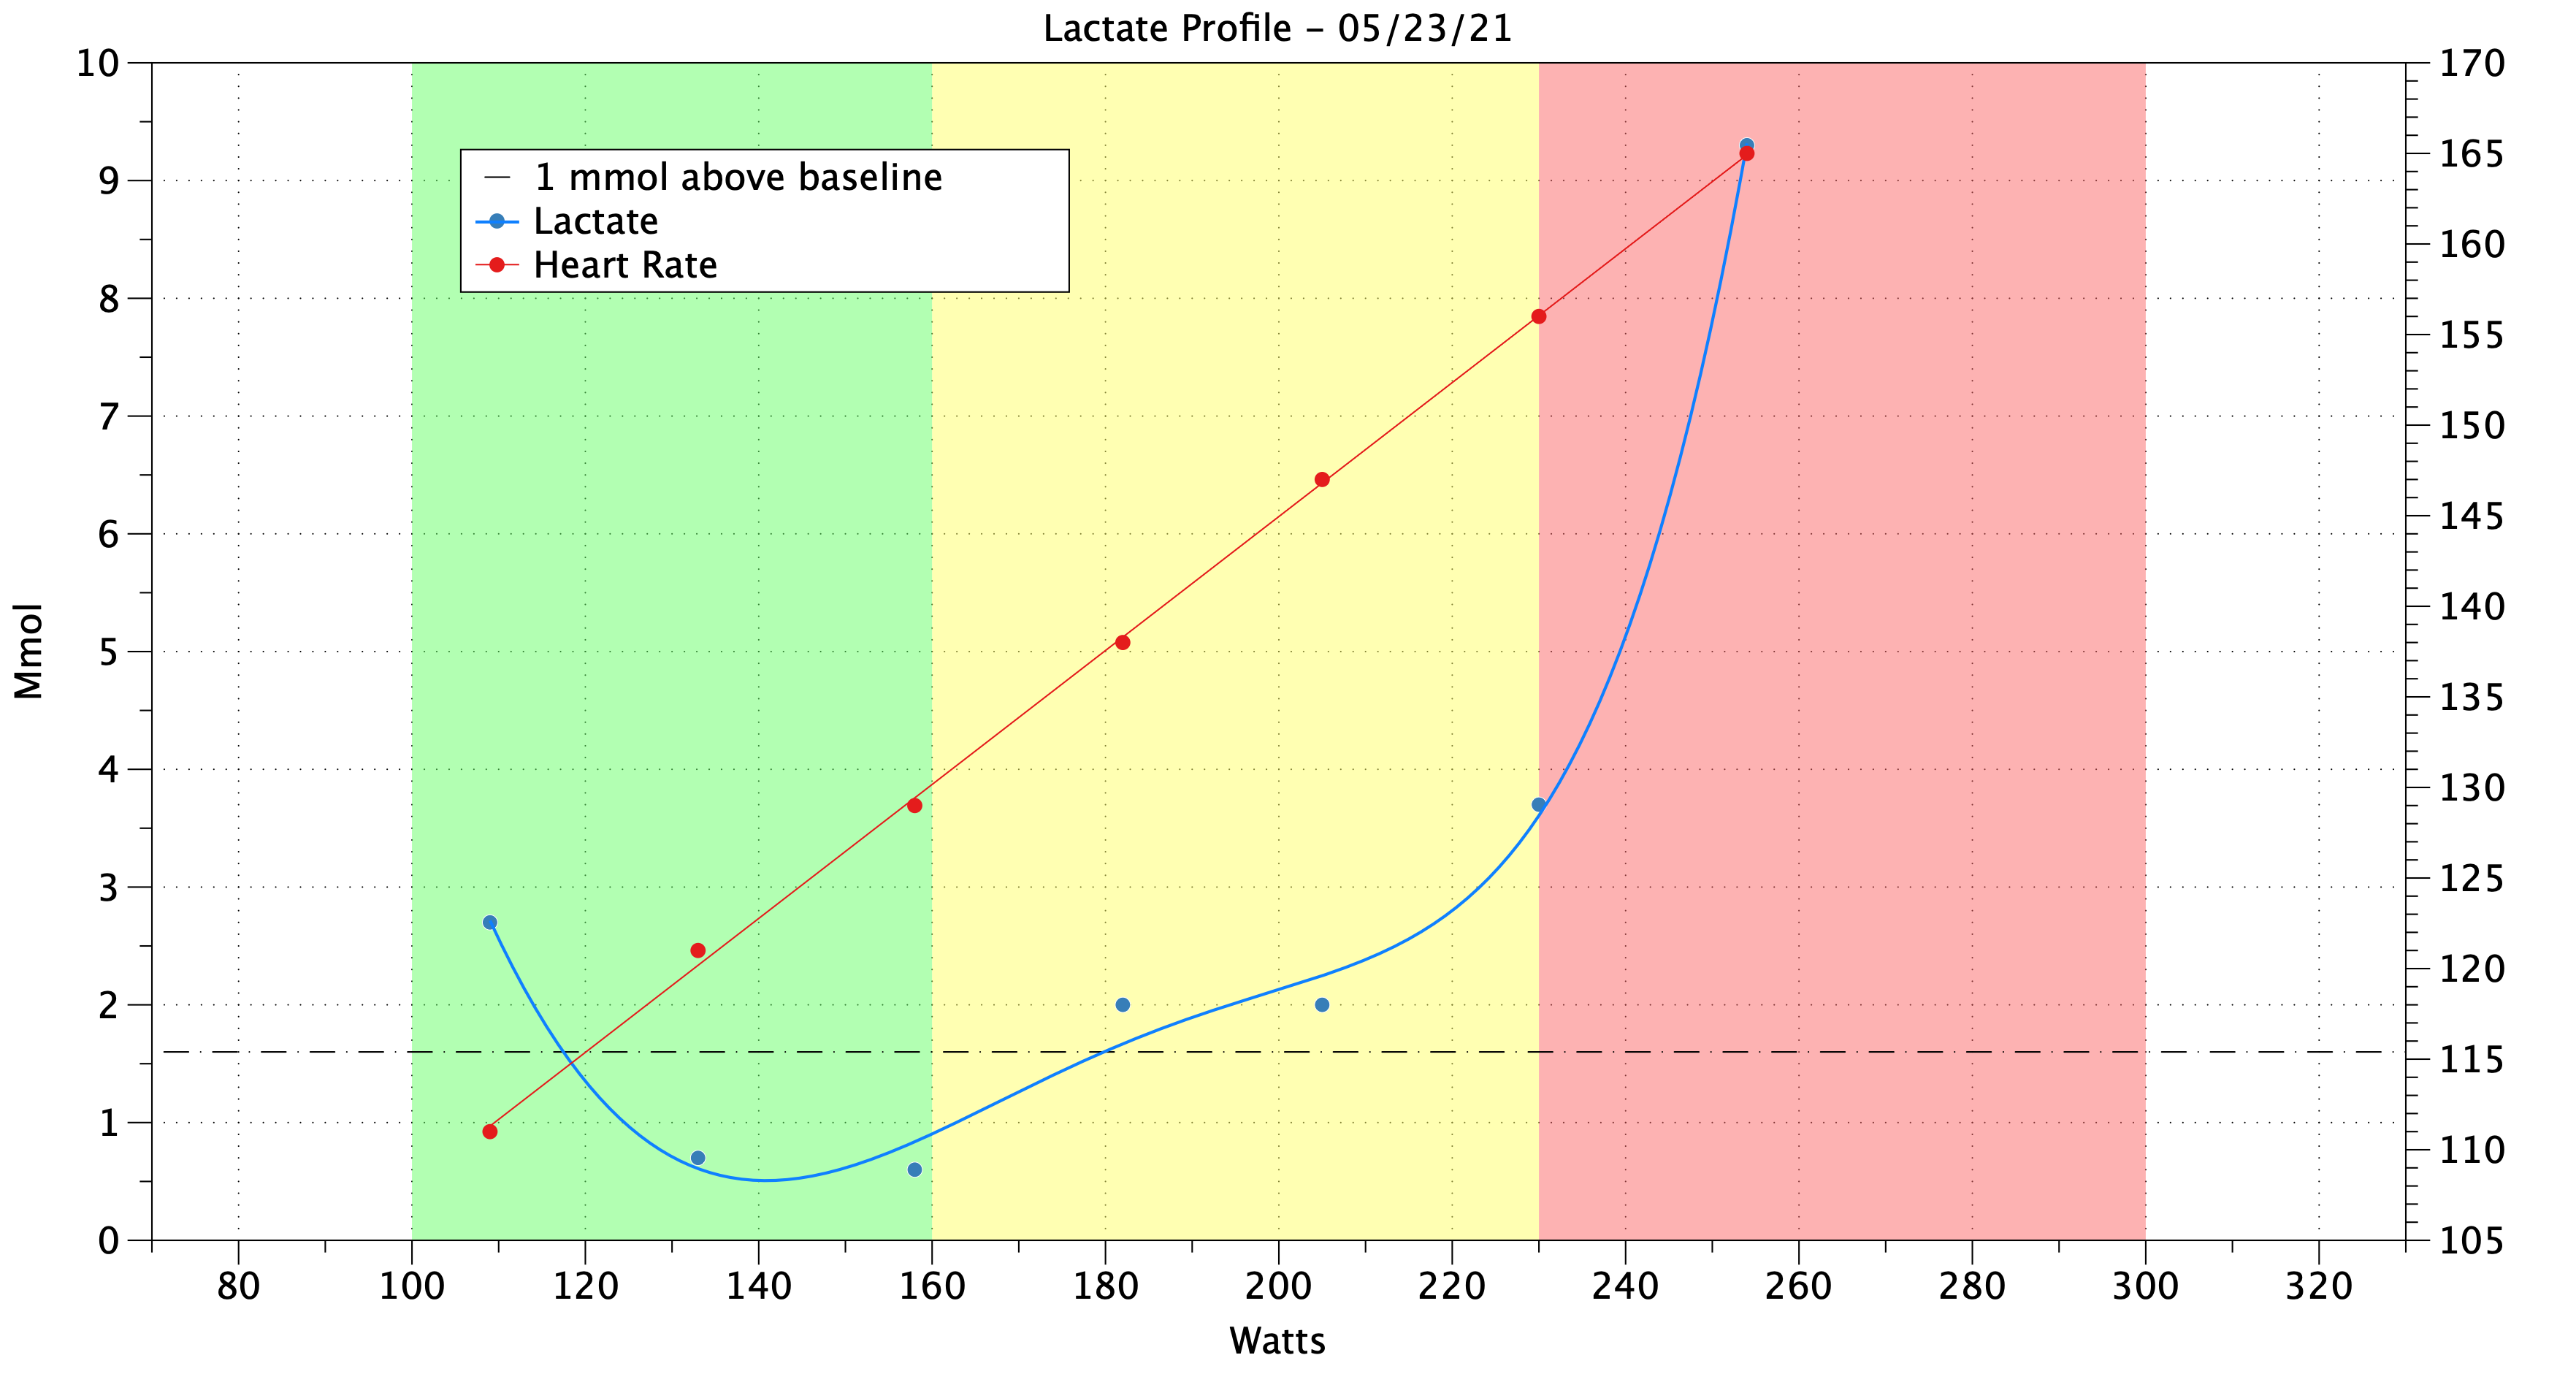
Below is your actual data, average power for each step and avg HR for last 1 minute of step.
You will note the 1.5 lactate is incorrect.
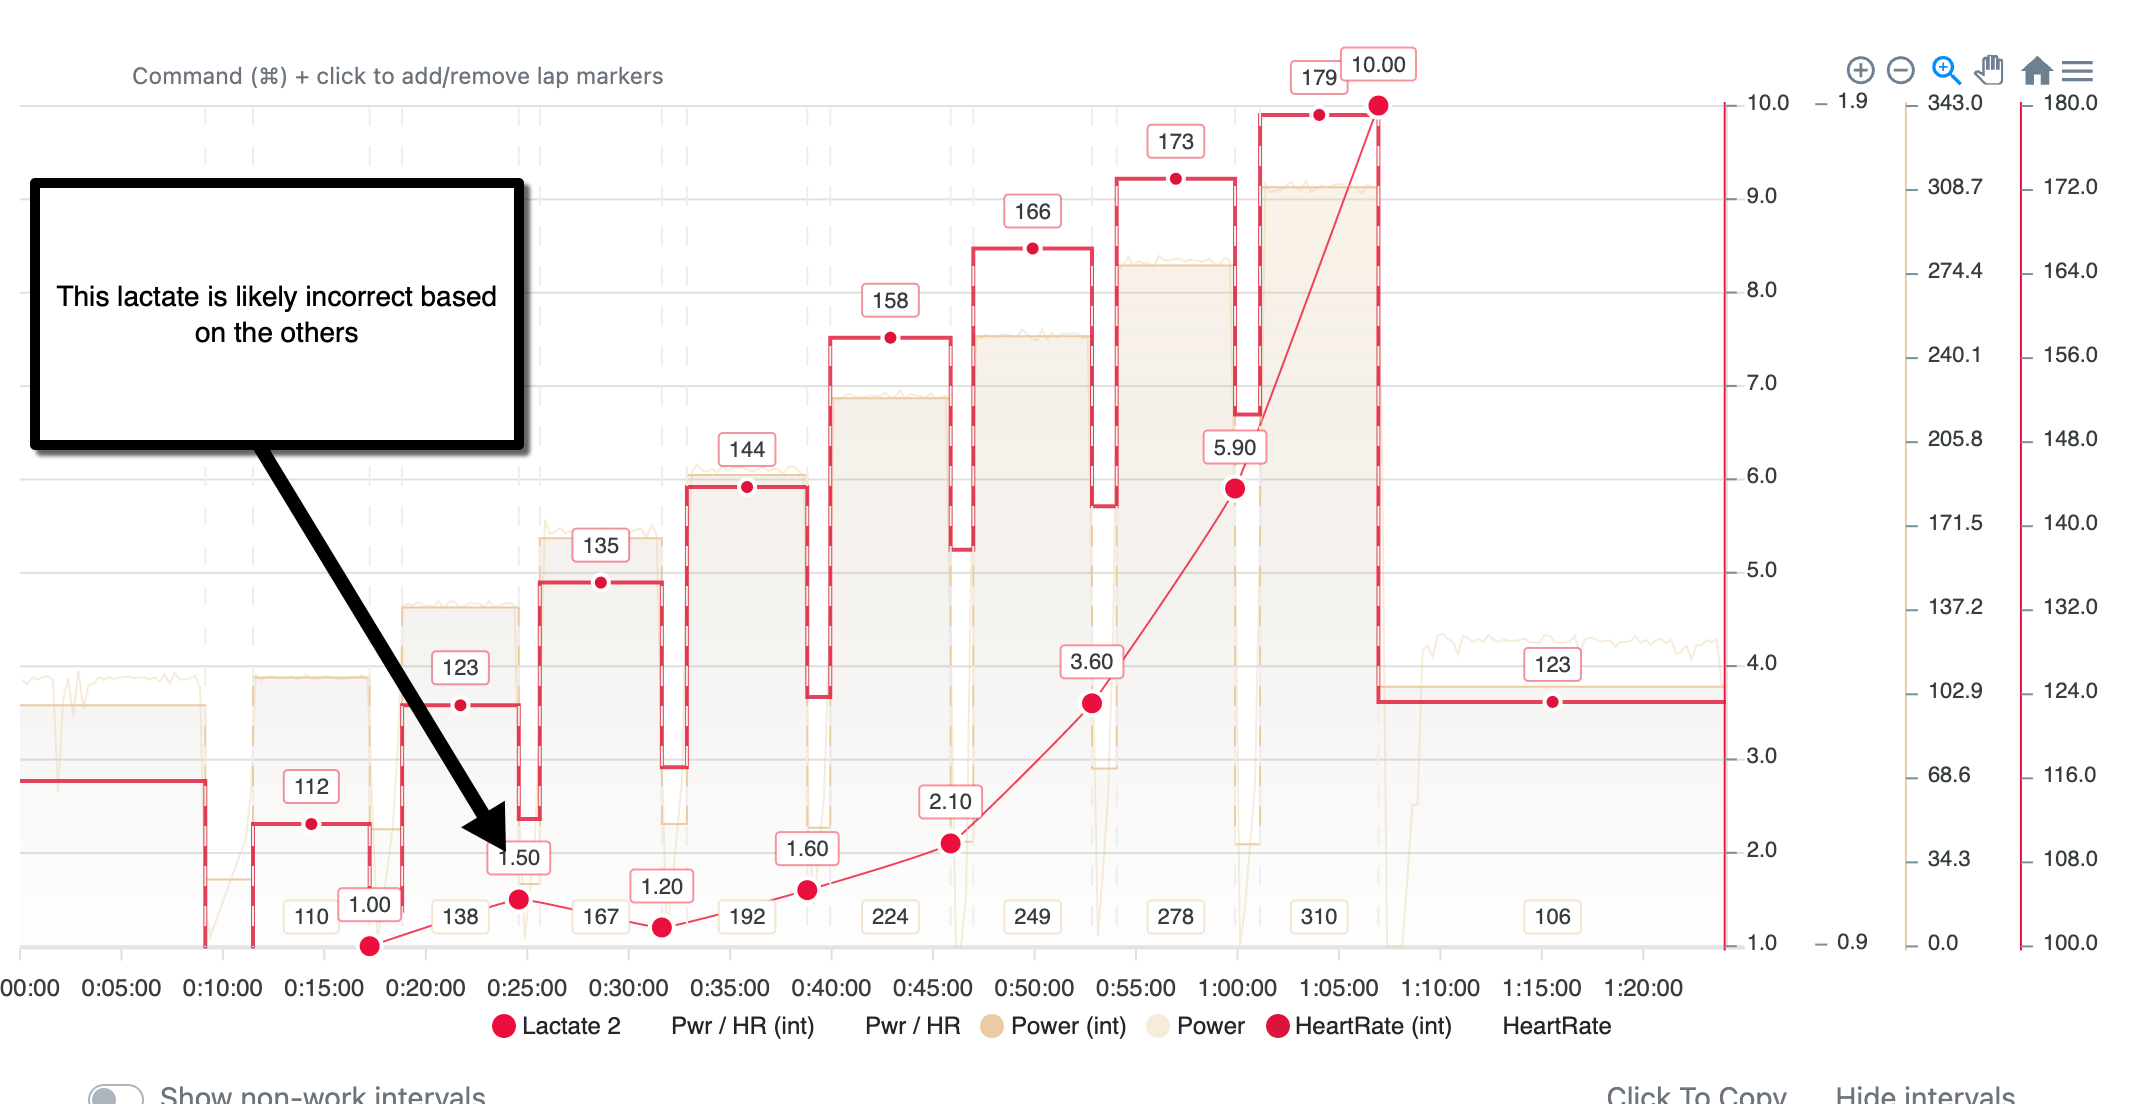
If I correct that lactate, I would put LT1 at
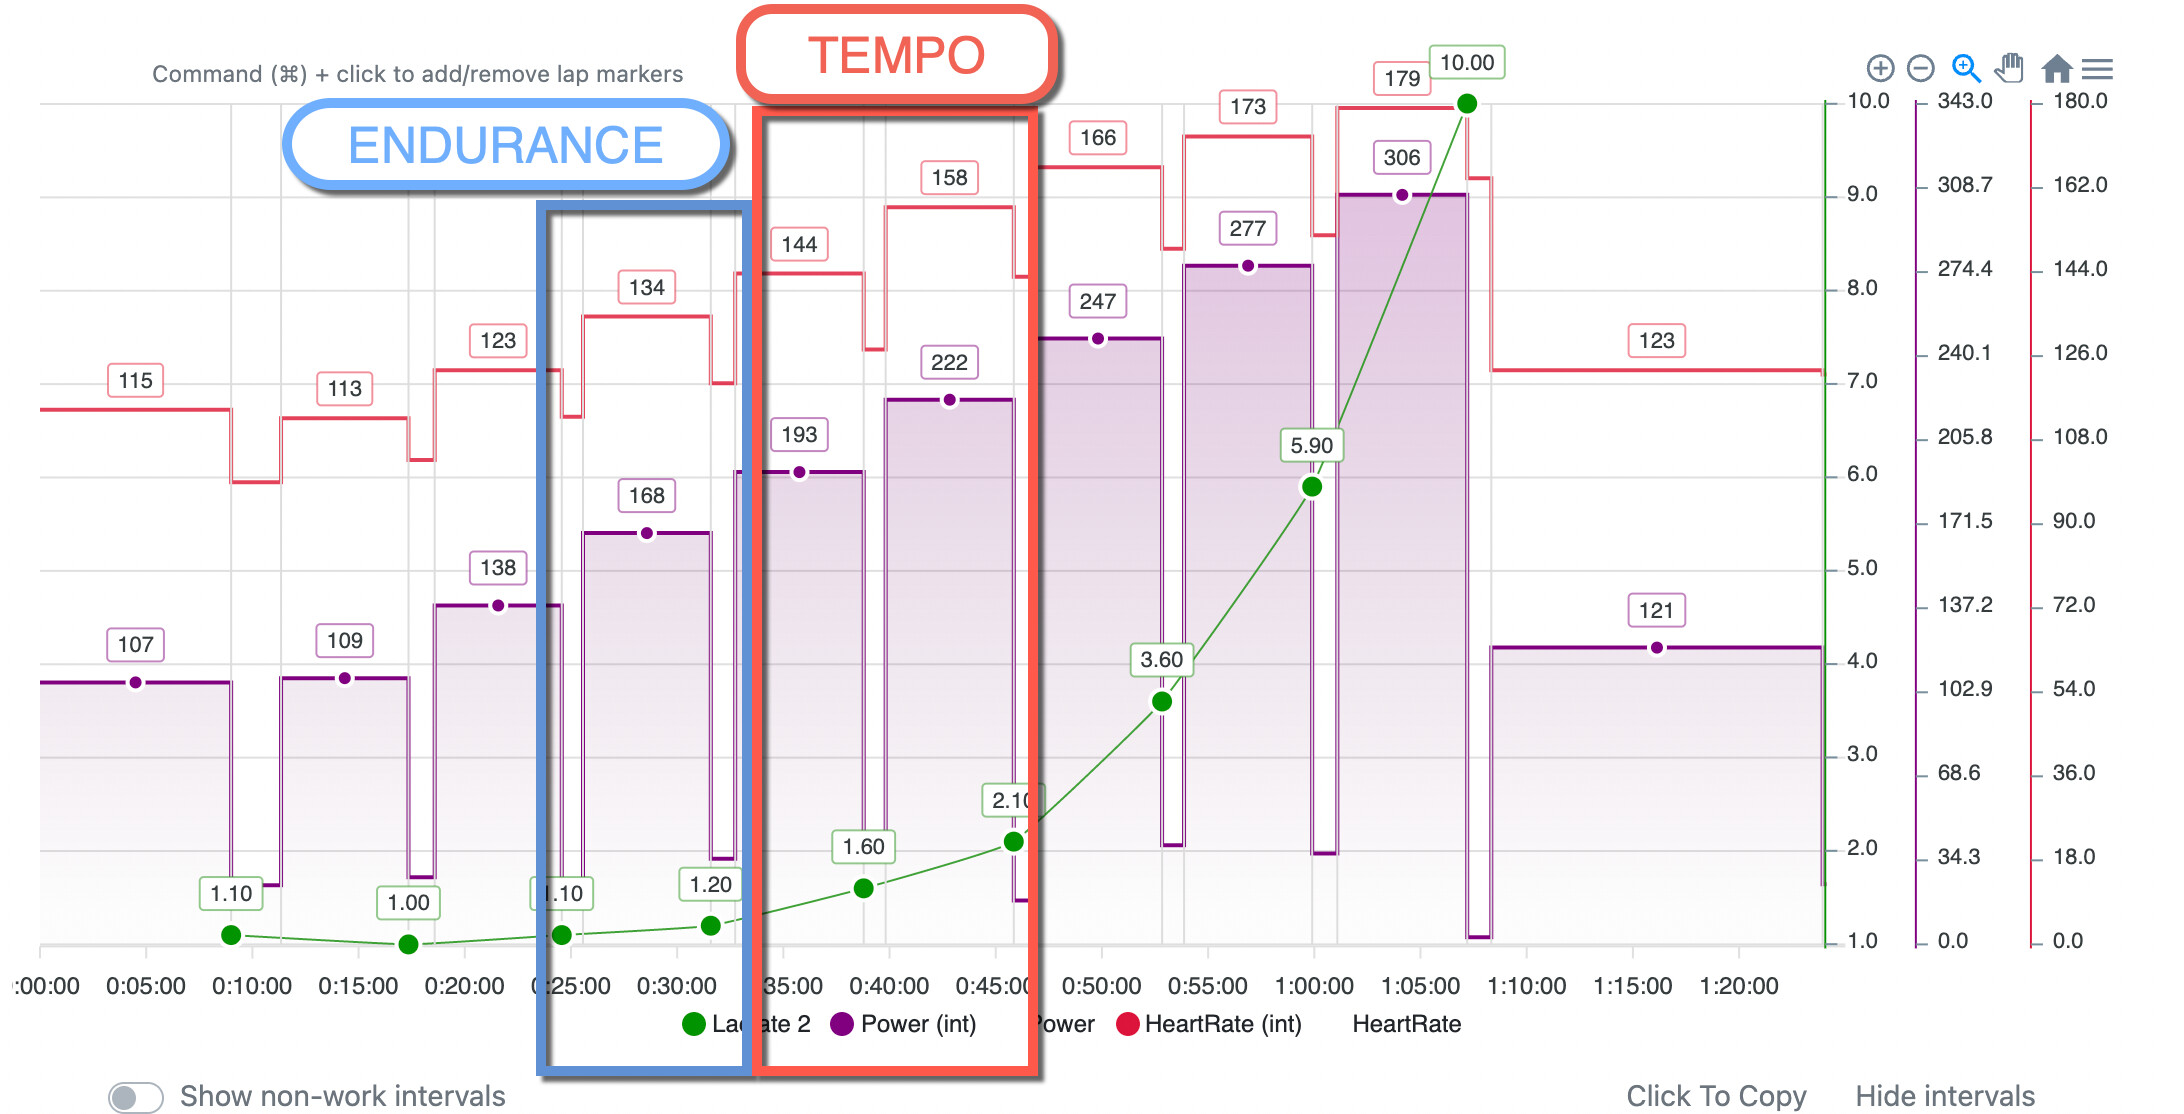
I would put LT1 at 134 heart rate and 168 watts.
There is not clearly defined LT2 in my opinion.
There is a second deflection at 158 heart rate and 222 watts, this would be ideal for tempo training, or you could go into this area on climbs during endurance rides as well but don’t spend too much time there unless the goal is tempo.
I see lots of tests like this without an LT2.
I know everyone has a different opinion on first onset of lactate deflection (that is mine) or 1mmol above resting, I just tend to use the first.
If you look at the max heart rate in the test of 180 it would put training at the following:
Endurance 168 watts, 134 heart rate (75% of max - right inline with the top of my ceiling by heart rate)
Tempo 222 watts, 158 heart rate (88% of max - this is actually a little higher than my suggested ceiling of about 83%)
Now, you could have a higher max heart rate and NOT reached it during this test which would drop those % heart rates above, putting the heart rate even more in the zones I like to see.
You have good data here for future LT1 testing, and as your endurance system improves or fat utilization you will see the lactates drop after the 2mmol area and then likely see an LT2 deflection start to form.
2 Likes
Lots of great info, thanks so much!
1 Like