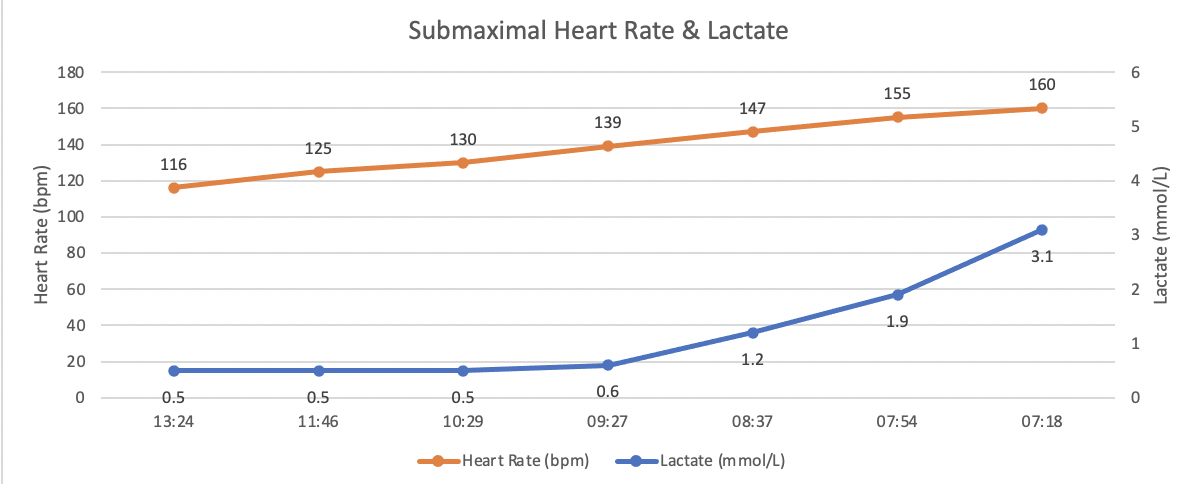
Hey everyone, Coach Ryan here with a fun little physiology activity to put out there. See the attached image of a lactate profile. Can you identify LT1 and LT2?
What else do you see going on here? For reference, this is a runner, so you will see pace (min/mile) on the x-axis and HR and Lactate on the primary and secondary y-axis.
@Aaron_Pool, thanks for replying! Yes, excellent assessment. This particular runner is 64 years young and has been running for some time now. He is looking to qualify for Boston and has picked up a running coach over the last year or so. One particular area that he has improved upon is his aerobic fitness by doing a lot of base training with his coach. This lactate curve is a great representation of those adaptations that can take place.
His qualifying standard for Boston would put him at minimum 9:21 min/mile, and we can see in his results that this would be a fairly light effort for him based on his current results.
He did complete a maximal run protocol after this and achieved a peak aerobic speed of 6:25 min/mile, which was an impressive result.
What kind of marathon and half marathon pace does the board think he can run based on that information?
I think this is great if you have access to the right testing protocols. What are your thoughts on how we could approximate this without a lab and without relying on the typical percentages of max HR? Is there anything that could perhaps be used to ‘tune’ the percentage-based approximations?
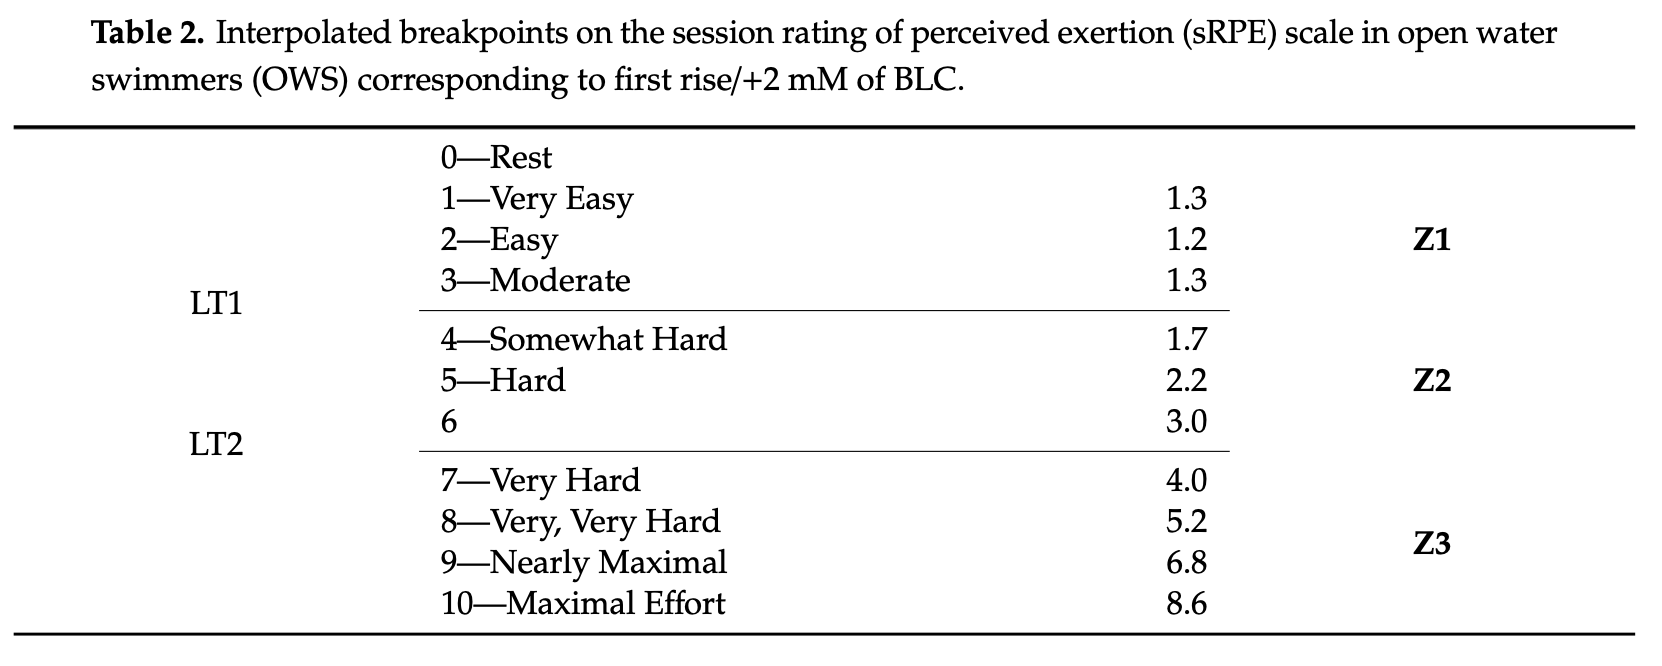
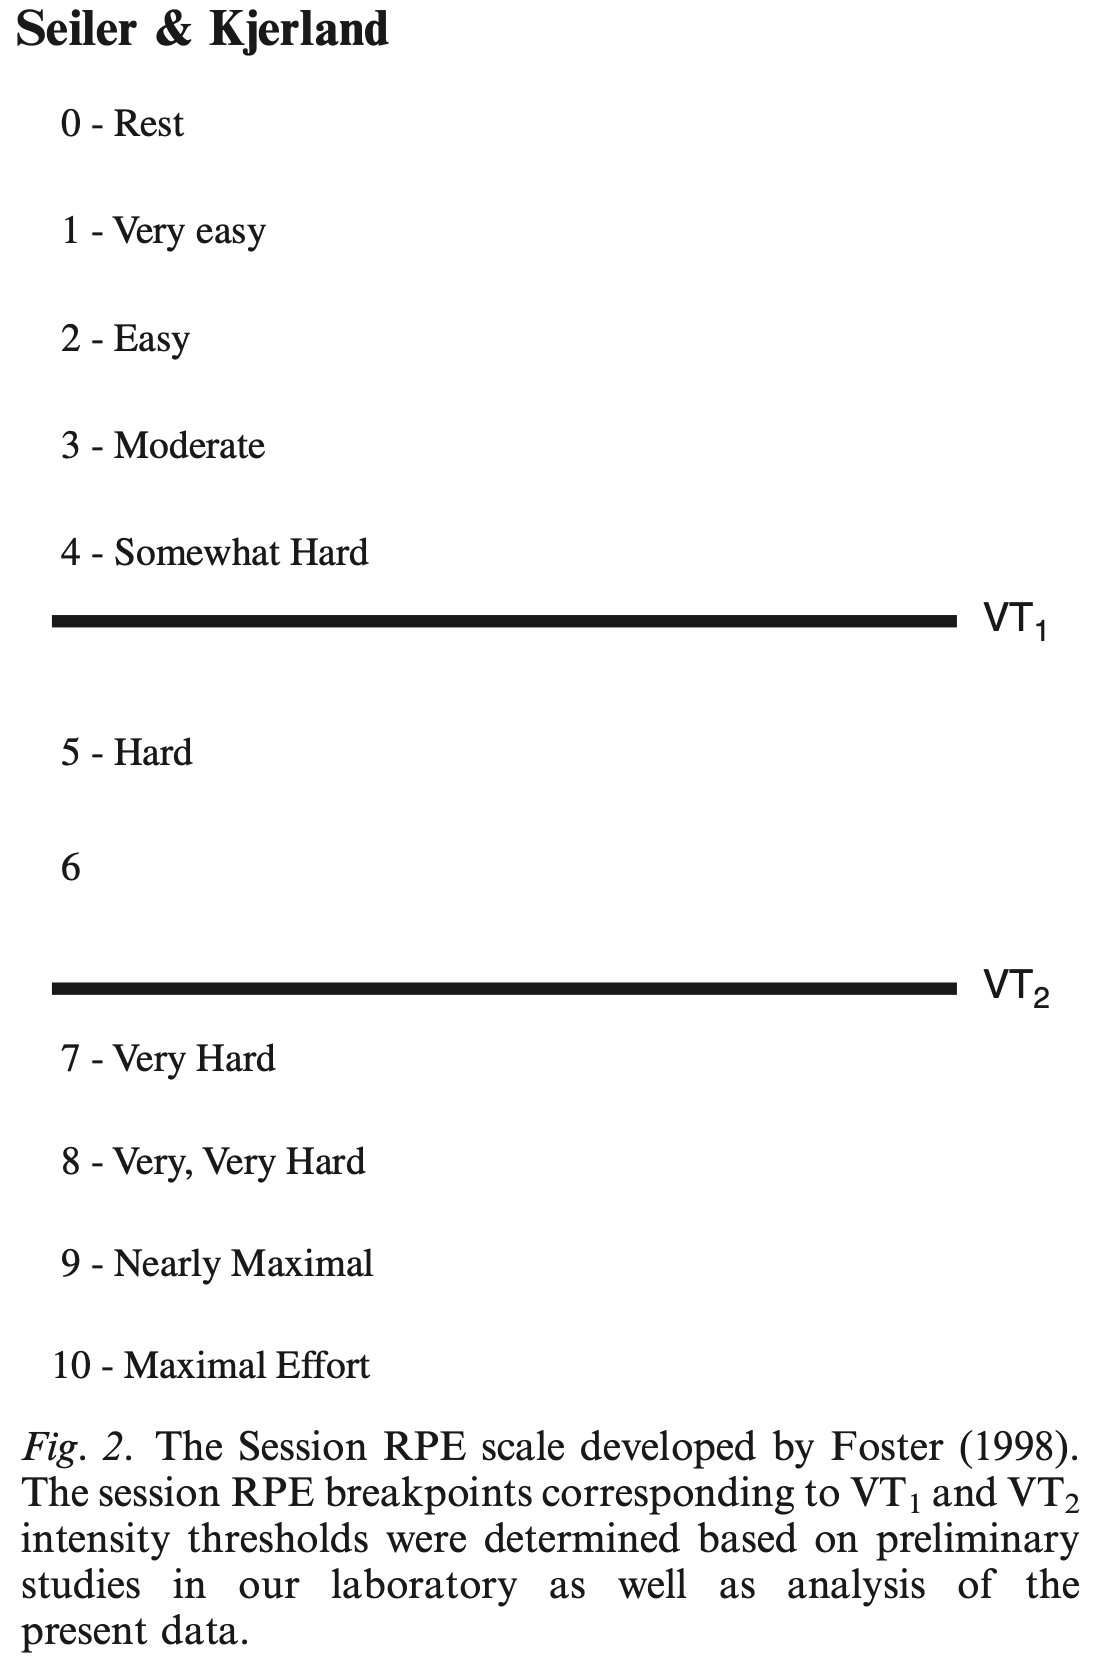
Yes, great question. There was a very interesting paper that was just published in 2020 actually. This one looked at sRPE (session Rating of Perceived Exertion) in relation to LT1 and LT2 in open water swimmers. The snip below gives one of the figures highlighting the breakdown among training zones. Dr. Seiler published an excellent paper with Dr. Kjerland in 2006 where they examined training intensity distribution in elite endurance athletes and shared a similar graphic.
Having performed a lot of testing personally on the bike and run, and tested athletes from a wide range of experience levels, I think these are great starting points for you. Keep in mind these are specific to the activities and level of athlete, so these are useful as guides, but should not be expect to be exact for every person and activity. If you haven’t already, check out Dr. Seiler’s workshop How Long, How Slow that should also help!
Seiler, K. S., & Kjerland, G. O. (2006). Quantifying training intensity distribution in elite endurance athletes: Is there evidence for an “optimal” distribution? Scandinavian Journal of Medicine and Science in Sports,16(1), 49-56. doi:10.1111/j.1600-0838.2004.00418.x
Thanks Ryan! Those are some great pointers and advice. I’m still working on my ability to assess RPE. I tend to over-analyze things which can lead me to having trouble quantifying RPE without going down a rabbit hole of self-reflection … I have a reasonably well-established threshold heart rate and set of heart rate zones based on Andy Coggan’s 5 zone model. For base work I just try to stick to Zone 2 in that model and hope that’s where it needs to be for effective long, slow base work.
I came up with a way to assess my Z1 that kind of makes sense. Go out for a long (4-5 hr) steady/flat ride while fasted, or at least without eating carbs. If you’re riding below LT1 your heartrate will stabilize to a steady state. Hold that power as long as possible. If you can hold that power for at least 2 hours without cracking or seeing a significant cardiac drift, that heart rate and power should be right around LT1. This does depend on environmental conditions and maintaining hydration. My theory behind riding fasted is that you want to keep the body from utilizing much glycogen, which by my understanding is the indicator of being at or below LT1. This is in no way evidence-based, but I have done it and the procedure seems to give results that make sense.
Yeah, that’s interesting. I do watch my cardiac drift on those long ‘LT1’ rides. I think I can see an improvement over time if that’s what I’m working on, but in speaking to coaches and the people behind products like Xert they feel like there are too many potentially confounding factors in there - things like nutrition, hydration, heat, etc … I still find it intriguing though and will continue my own investigation of it for myself.
Steve, that’s interesting. As you and @neptuak said, we need to be aware of those confounding factors. If we can take those into consideration, you can certainly work out data from your long steady/flat ride that should give some insight into your Z1. For example, I’ll use tempo rides (zone 3 in a 5 zone model) with some athletes to check on sustainability, and generally holding an effort like that for 90 min to 2 hours would be completely reasonable to give insight into where they are in relation to LT1 and LT2. With your ability to ride consistently like that in Z1 for 4-5 hours I can see how you would then feel comfortable knowing that you are at or below LT1.
Coach Ryan
I watched a Steven Sieler video in which he too talks about cardiac drift and what it means for your aerobic fitness. There are a number of intriguing videos on his YouTube channel. This winter I am on a mission to build my base. When I really focused on that a few years back it made a massive difference to my ‘durability’ at or around threshold (which is perfect for my kinds of long endurance events).
Hi Michael,
thank you for your post, and welcome to the forum!
Can I ask a few questions regarding the protocol?
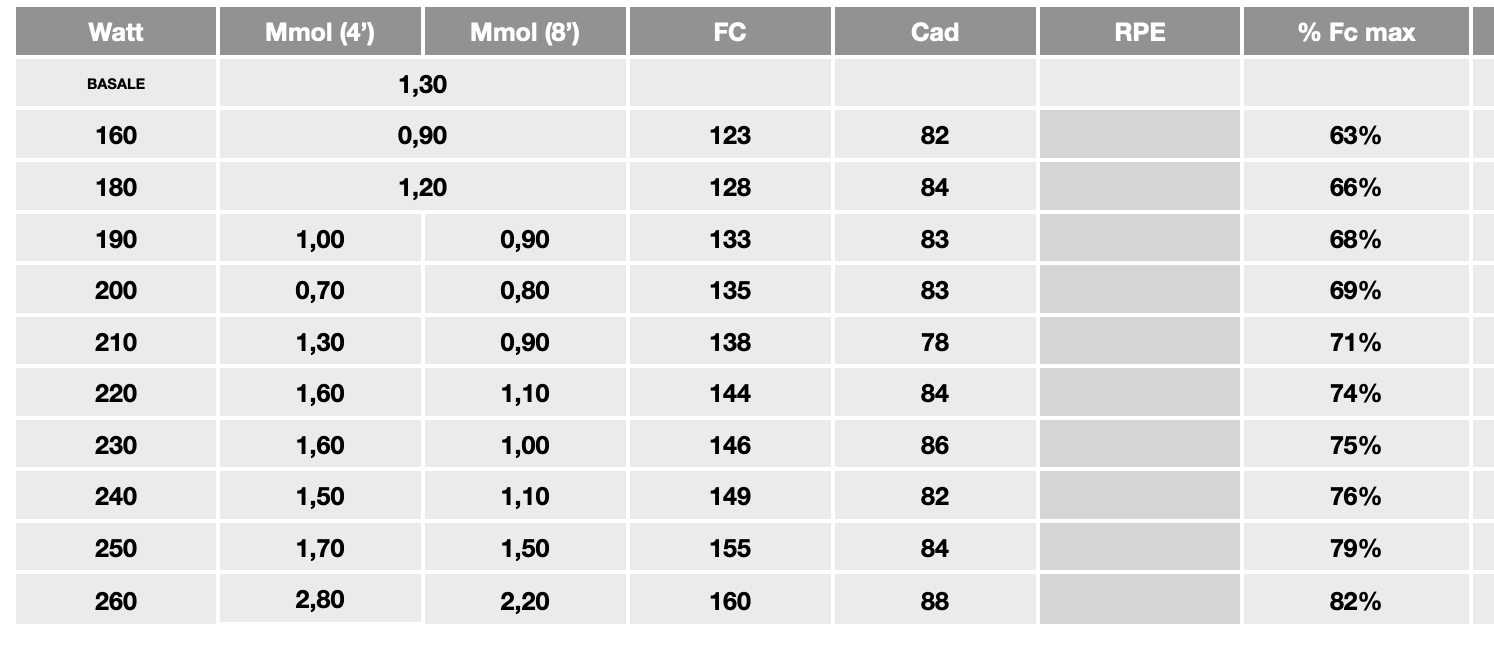
Is FC the athlete’s heart rate response? And %FC max, I am assuming is a percentage of maximum heart rate?
What drove your decision for the starting stage, and stage progression?
It looks like between the 220 stage and the 230 stage there was a drop. Did the athlete stop pedaling here for any particular reason?
This protocol is great. It is similar to Dr. Inigo San Millan’s protocol that I’ve used a lot in the past where we go 10 minute stages and sample at the 5th/10th minutes. Gives you really good insight into the lactate changes across that longer stage duration.
Hi Ryan ,
thank you so much for your answer, before I present myself:
I’m 29 from Aosta Valley in Italy, I was an MTB elite athlete for almost 10 year and now (after my degree and master in physical education ) I Coach MTB athletes Junior , U23 and Elite of my little region, I buyed an Arkray lactate pro during lockdown for evaluating my sister and I start to you mesure lactate.
The FC is AVG heart rate of the last 2min of the stage
% are of % HRmax
From 220 to 230 there was a pee break (toilet), and in the middle of the all stages he drink.
I decide to start with a 160w stage (for training me to take lactate, i’m new to this, I’ve try only with my sister before during lock down, same protocol for LT1 and the alpe Zwift Kom with lactate every 5-10minute)
180w (3,2 w/kg) is 60% (62%) of Critical power of June (290) after corona virus lockdown (2 month, and worst form of the season) , and I thinked the form con be similar to now (off season, and he had corona virus in the end of october) , but in the race season probably CP / FTP was more higher, he have power meter only on road bike and almost all high intensity and race pace workout was in MTB, and he race a lot from august to October.
He’s a very high level athlete, 3rd in Junior World champ last year (mt. S Anne), and TOP10 in October at U23 european Champs at the first year in this category.
I’m just an endurance self coached athlete (MTB XCM) from Hungary, and i have no any previous experience with lactate measurements. But now i just got a Lactate Scout 4 and will try to have my first test (with help) next week.
What would be your ideal testing protocol for lactate test? I mean 5(6) or 10 minutes / step? Is one measurement / step would be enough ( consider cost)?
I would start with 60% of my FTP with 6 minutes steps(+0,5W/kg each), measure at 5-5:15 to have time to re-test if anything error happens until exhaustion. BTW is pedal until exhaustion necessary/useful ? After “blowout” should i keep very light pedaling or i should have complete stop to have a maximal lactate level? If i’m right i should measure after 3’ , 6’ , 9’ min after it right?
Any other test i should consider? MLSS? Or a clearance test?
Hi Michael,
thank you for your replies and clarification on some of those points within the test. Looking at just the lactate response, I would establish his LT1 at 220 watts. How much does he weigh, roughly?
The other thing I notice is that there is a lot of variability in the lactate measurements from 4’ to 8’ on some of the measurements, so we have to consider the sampling technique and if we are getting some errors potentially in the 8’ mark. With the 1,30 and 0,90 on the 210 stage, and the 1,60 and 1,00 on 230 stage, those are larger variations than I’m used to seeing.
I would recommend using larger jumps in the intensity (I tend to go closer to 0.5 w/kg, or around 30-35 watts/stage for riders around 70kg) to give better movement to those lactate numbers and allow you to zero in on where those changes are taking place.
Out of curiosity, what is his peak power production, and have you measured his peak lactate response?
So my first question is what you are looking for with this test - is it to identify LT1 and primarily address those lower aerobic zones accurately, LT2 for threshold estimation, or look at a combination of the two?
Do you have someone who is comfortable in taking lactate samples? Will these be fingertips, earlobe samples, etc.?
I see you mentioning the “blowout” period and assuming this is just when you reach failure during the test, not the 5 minute blowout before the typical 20 min field test, correct?
Because you are an MTB athlete with the XCM focus, I would recommend assessing all of the above as MTB performance will involve all areas of your fitness. I would look at a protocol such as:
4 minute stages starting very light (0.5-1 w/kg) and increasing by 0.5 w/kg every 4 minutes. This rate will allow your lactate levels to stabilize enough without requiring you to ride too long and potentially fatigue before the end of the test
collect lactate (and heart rate and perceived effort) samples at the end of each stage (ideally the final 30 seconds, but if you or your partner have not practiced this enough just yet, be sure to do it, because it’s always a bit stressful in real time and the chance to miss a sample is very real)
Once you reach a point where you would identify your threshold/LT2, stop and recover for around 5 minutes. Then,
Start one stage below your threshold and ramp up 25 watts/minute until exhaustion. Do not collect lactate samples at this time. This is just a scenario where you ride as long as you can.
Following that test, you can sample a post-test lactate at 3, 5, and up to 9 minutes to get a peak lactate response and also start to see what your ability to clear is looking like.
This protocol will allow you to get LT1, LT2, and a good feel for your maximal lactate production. I’ve used this for many years and it is a good all-around way to get started.
Thanks!
Coach Ryan
My target would be to identify LT1 \ LT2 as im on a polarized training “model” it would be the most important for me. But what would be the combination of the two as you mentioned?
Yes, i have a help who is familiar with (unfortunately) daily several blood sugar level measurement from her fingertips, but i would go this time with earlobe samples.
Correct, i meant blowout as the failure watt level and the very end of the whole test procedure.
Thanks for the protocol description, i will try that after the Holidays.
Do you think is there anything else i should try measure? I mean is somehow lactate measurement in the zone 6 model, any use to if not 100% correctly but more or less mark the zones above TH? Thanks!
Thank you Ryan , yes surely I need more practice to take sample, I touched the skin during the mesure at 4’ , at 8’ minute never.
He’s Weight 58kg.
Peak Power output mesured at Mapei research center last Monday was 400w and VT2 (325w) (+25w-60" protocol). He test every year in december from 2018 , before restart training.
I don’t have a Peak lactate production.
Thanks for you advice.
Michael
Hi @passista, thanks for the info. Yes, so I use that protocol to get a lot of information in one shot. You can certainly do a shorter protocol and leave out the maximum effort if you are interested in only LT1/LT2. I do like to get a feel for maximum lactate response as that is useful in relation to LT1 and LT2 throughout the season.
I think that’s a fine way to start off. I typically don’t test anything else beyond LT2 other than peak lactate and recovery lactate at times. Once you’re above LT2, trying to differentiate between those higher zones based on lactate do not seem appropriate.
Let me know how it goes when you do your testing!
Coach Ryan
Did my test… is it the the “diesel engine” looks like? :))
Lactate measured at the last 30 sec of each step
LOAD LACTATE HR
0 W 3.2 60
180 W 0.9 125 (15min warmup)
210 W 1.6 132 (5min)
240 W 1.0 145 (5min) possible measurement error?
270 W 1.9 160 (5min)
300 W 4.8 172 (5min)
330 W 10.3 182 (5min)
360 W 13.7 190 (3 min) failed the finish the whole step, out of breath, full stop
0 W 11.2 98 (+ 5 min after the previous measurement, no pedaling)
0 W 9.7 90 (+5 min after the previous one)
I would assume:
LT1 is around 270 W
LT 2 good question , but my feelings: around 300W
What do you think? I def should stick with XCM and no go to XC
I actually did 2 test, but was way to tired 2 days ago, and not eat enough before test… That has started slightly lower load with bit longer steps
That was:
150W - 0.7 mmol (15 min)
180W - 0.7 (6min steps)
210 - 0.9
240 - 1.3
270 - 2.1
300 - 6.3
330 - 16 (4 min,blowout, but max hr was just 181, while my measured max is 195)
 I have a reasonably well-established threshold heart rate and set of heart rate zones based on Andy Coggan’s 5 zone model. For base work I just try to stick to Zone 2 in that model and hope that’s where it needs to be for effective long, slow base work.