This one is above my head and appears to be something we could do with just HR/HRV??
Any layman explanations on this one?
This one is above my head and appears to be something we could do with just HR/HRV??
Any layman explanations on this one?
@carytb Posted about this topic here:
and here:
Also there is a podcast with Bruce Rogers (primary author on that Frontiers paper) on Endurance Innovation podcast.
I tried out the HRV Logger (from HRV4Training Marco Altini) and got HR consistent with what I get at LT1. I also used the “Real Time” view in HRV Logger during a few rides and found it useful.
Try the podcast first. Bruce did a good job (I think) of making it digestible for layperson (me). If you decide to dig deeper, you will either need Kubios ($ ??) or the HRV Logger (~$7/US), and an understanding of the (simple) protocol (basically: establish steady state, are you above or below .75 DFA alpha 1…if above, you are lower than aerobic threshold, if you are below .75, you are above aerobic threshold…so lower DFA alpha 1 index is more intense).
Thx for sharing this. I have used Altini’s HRV4training daily for years. I recently got the HRV logger app but hadn’t used it. I listened to the podcast and will now start using the HRV logger app. Perfect timing, with the rollout of Fast Talk Labs and all the Seiler refreshers on 80/20 polarization.
HRV Logger might be the tool to most easily deterimine LT1 and HR/Power to stay under for the easy 80%.
HRV is the holy grail of health monitoring, HRV logger may be the holy grail of LT1 determination/monitoring/updating!
Again, thx.
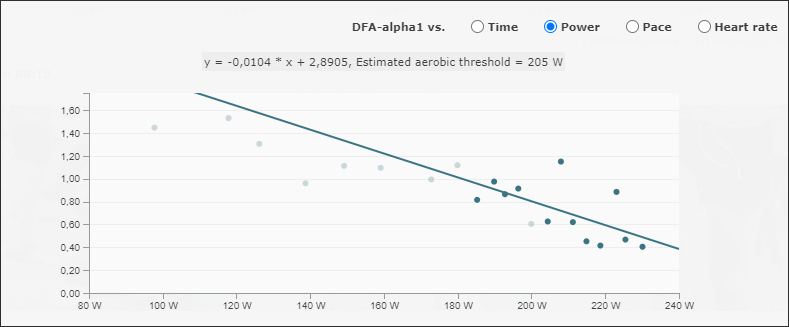
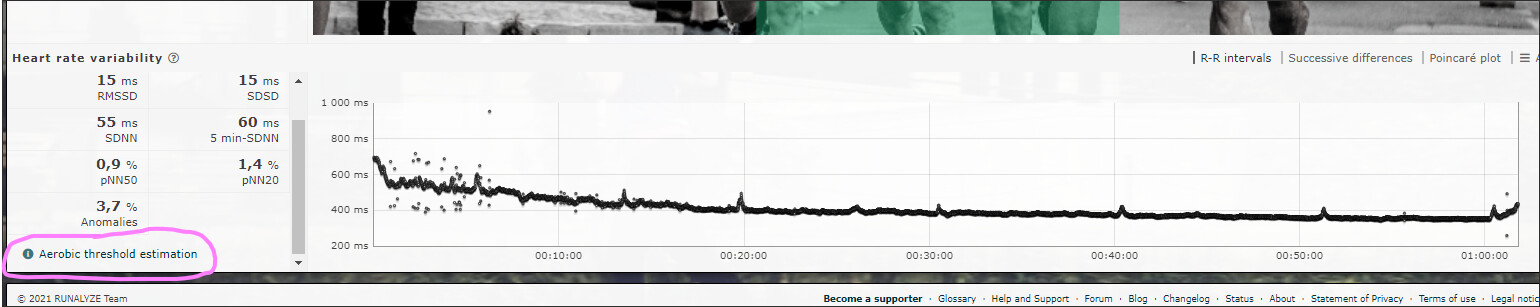
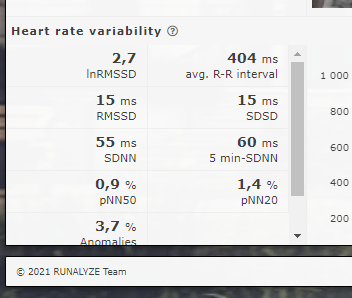
Excellent podcast. Reading around the subject, there’s another option here Aerobic threshold estimation based on HRV. using Runalyze.
I’m hoping to try this on the bike very soon, but following the podcast, it’s clear I need a better HR sensor!
Despite its name, I can see no obvious reason why I can’t upload a bike-based file to Runalyze.
If you try out HRV Logger, Marco (via email) suggested the following under Settings:
I left the rest as defaults. Also, used Tickr but via Bluetooth (not Ant+)
Thanks for creating this very interesting topic! I gave the test a shot this morning. I’m sharing this not as an expert (I would not even be able to coherently explain what DFA a1 is!), but just for the sake of those interested in some results. I’m just an average cyclist who likes data and tries to train as efficiently as possible by spending lots of time below aerobic threshold.
Setup:
Tacx Neo 2T, Tickr heart rate monitor, HRV logger app
ERG mode: 18 minute warmup, then 6 minute/10w ramps, starting at 160w
HRV logger setup: 2 minute computation window; 20% RR-intervals correction (I got this wrong)
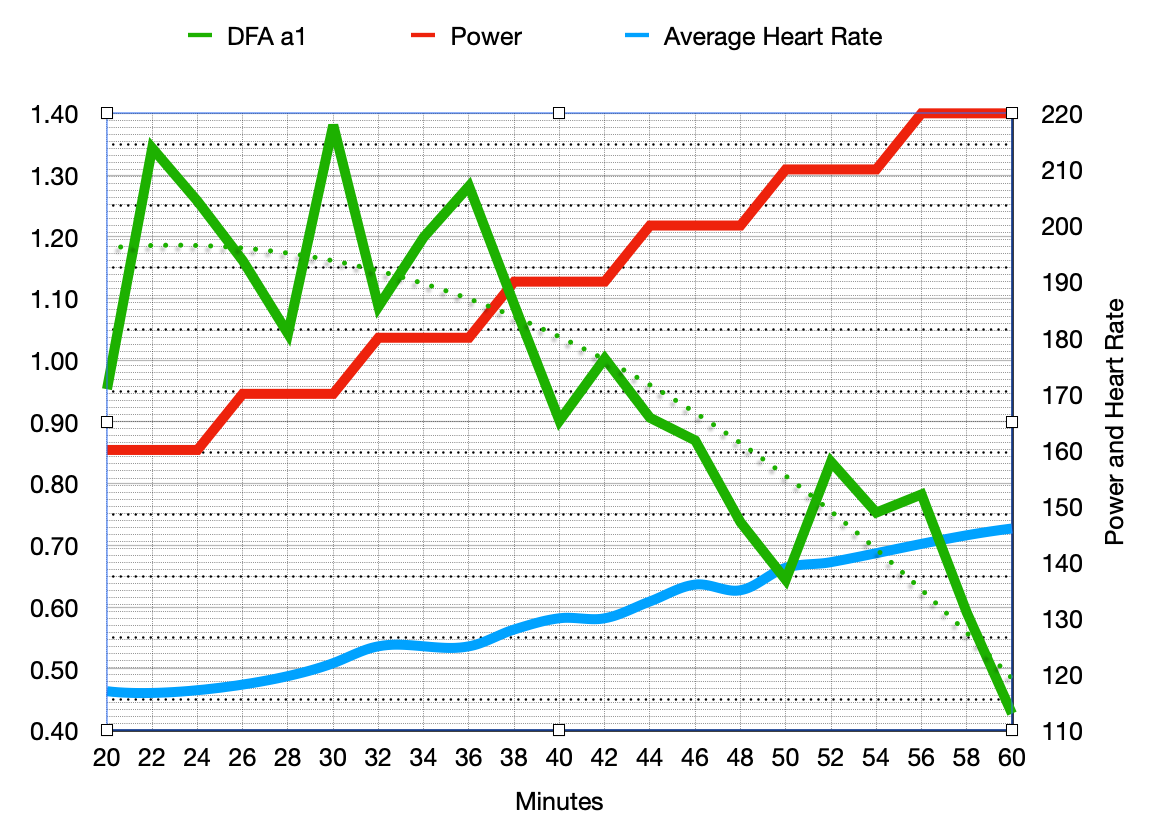
Results:
Interpretation:
Next steps:
I used this running for the first time. 30 minutes, 3 miles 1st mile easy, walk 1 minute, 2nd mile super easy, walk 1 minute 3rd mile hard. Very cool. HRV responds almost immediately to change. Seems to correlate to where my LT1 shouild be. Definitely want to check this out further.
Should be great on bike tool if accurate. In real I could check it during a ride when there might be some cardiac drift and might need to lower power to stay below LT1.
Pretty excited about this. Essentially free ability to determine/monitor LT1. Could be the holy grail of LT1 determination (like HRV4Training is the holy grail of health monitoring.)
I used a 10 year old Viiiiva HRM strap. I’ve ordered a Polar H10 to be a bit perfectionist since this is considered the “gold standard.”
I’ve done a few tests using it and after switching to a Polar H10 I’ve got some confusing results. The latest one I did 30 minute gradual warm up followed by 8min steps going up and then coming down. to give some context I’d always thought and therefore based my training on an LT1 of 132bpm/160W give or take and using a Tickr confirmed this. However my latest effort seems to show something completely different. Going up, 146bpm/190W and coming down 141bpm/155W. Other tests with the H10 have given LT1 of 140-144. Ironically I started using this method to give another data point, hopefully confirming what I thought but I’m now even more confused. I’ve disregarded the first 4 minutes of each step on the graph.
Fascinating stuff! Not being a computer guy I wonder how to compose these graphs. I have downloaded the HRV logger app, so I would be able to figure out the DFAa/HR relationship at VT1. Obviously being able to plot DFAa vs. HR vs. power and looking at it post exercise would be great.
And guidance is more than welcome.
I tried Runalyze’s analysis this morning. I can’t use HRV Logger as I don’t have any Apple devices.
I used quite a granular protocol of 4 minute stages and 5W increments.
The value it predicts appears reasonable and in line with my expectations. So much easier than blood lactate sampling!
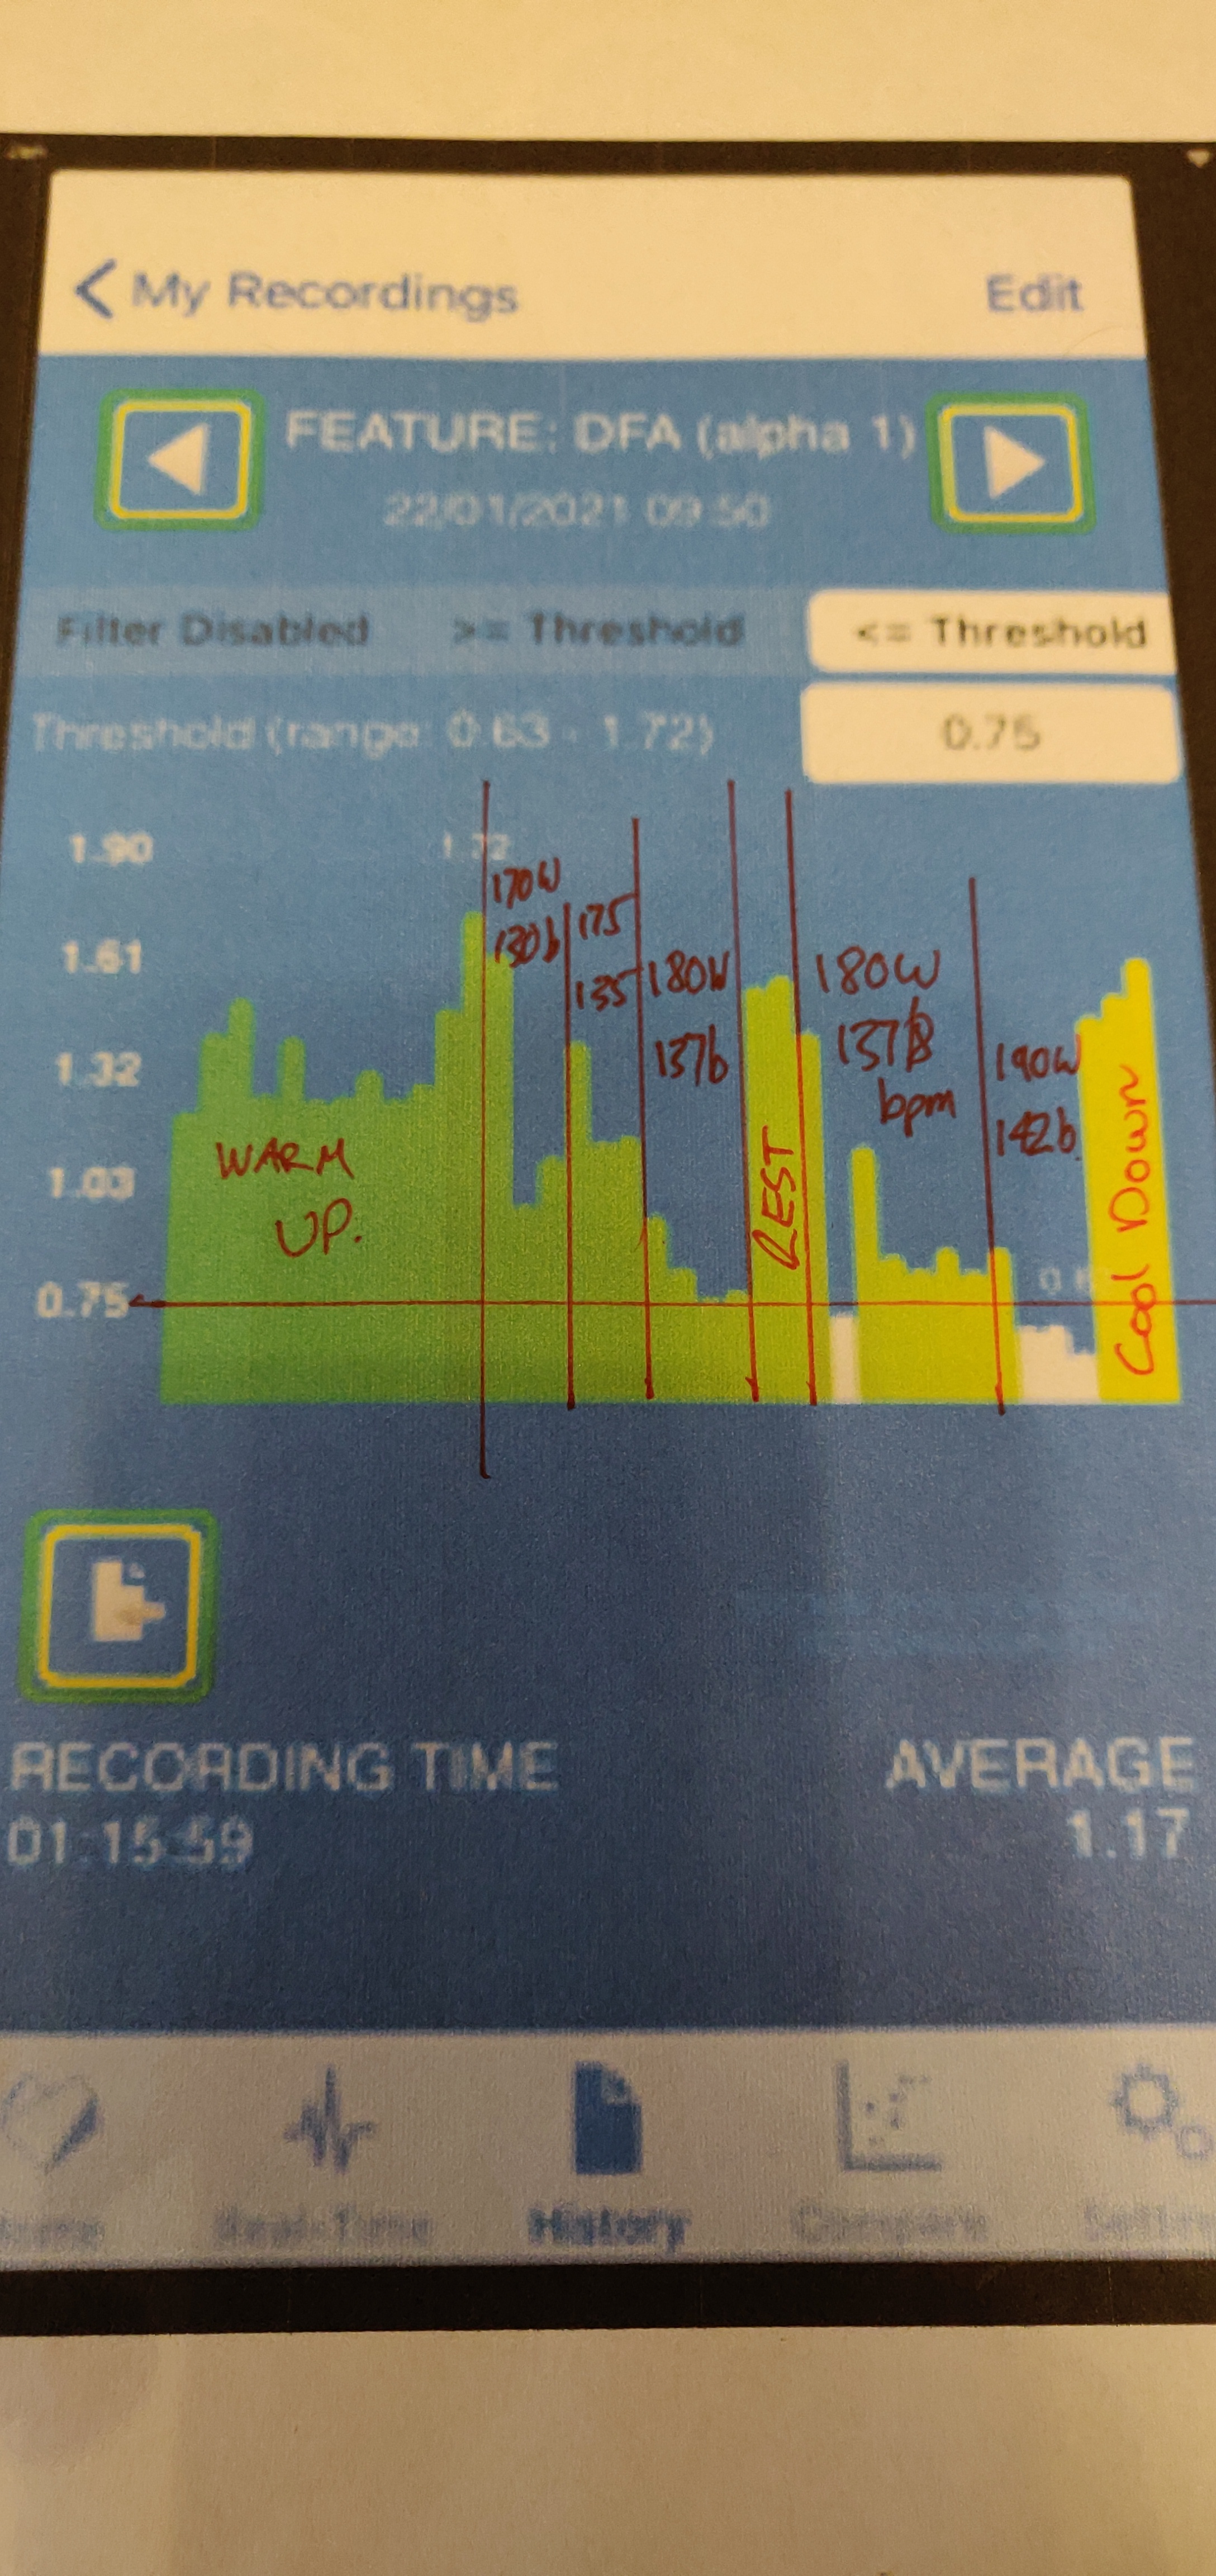
Until I can figure out how to download the file from my wife’s iPhone to my dropbox I have a notebook by the bike, set my Garmin to 2min auto laps then take a note of the Alpha1 after every 2 min interval. Afterwards put them into a table Google sheets and insert a chart. Not very elegant but it seems to work.
Thanks! I guess I will be able to do that 
An even less elegant way but with my computing skills a lot faster!! I reckon from this 139/140bpm at 180/185W
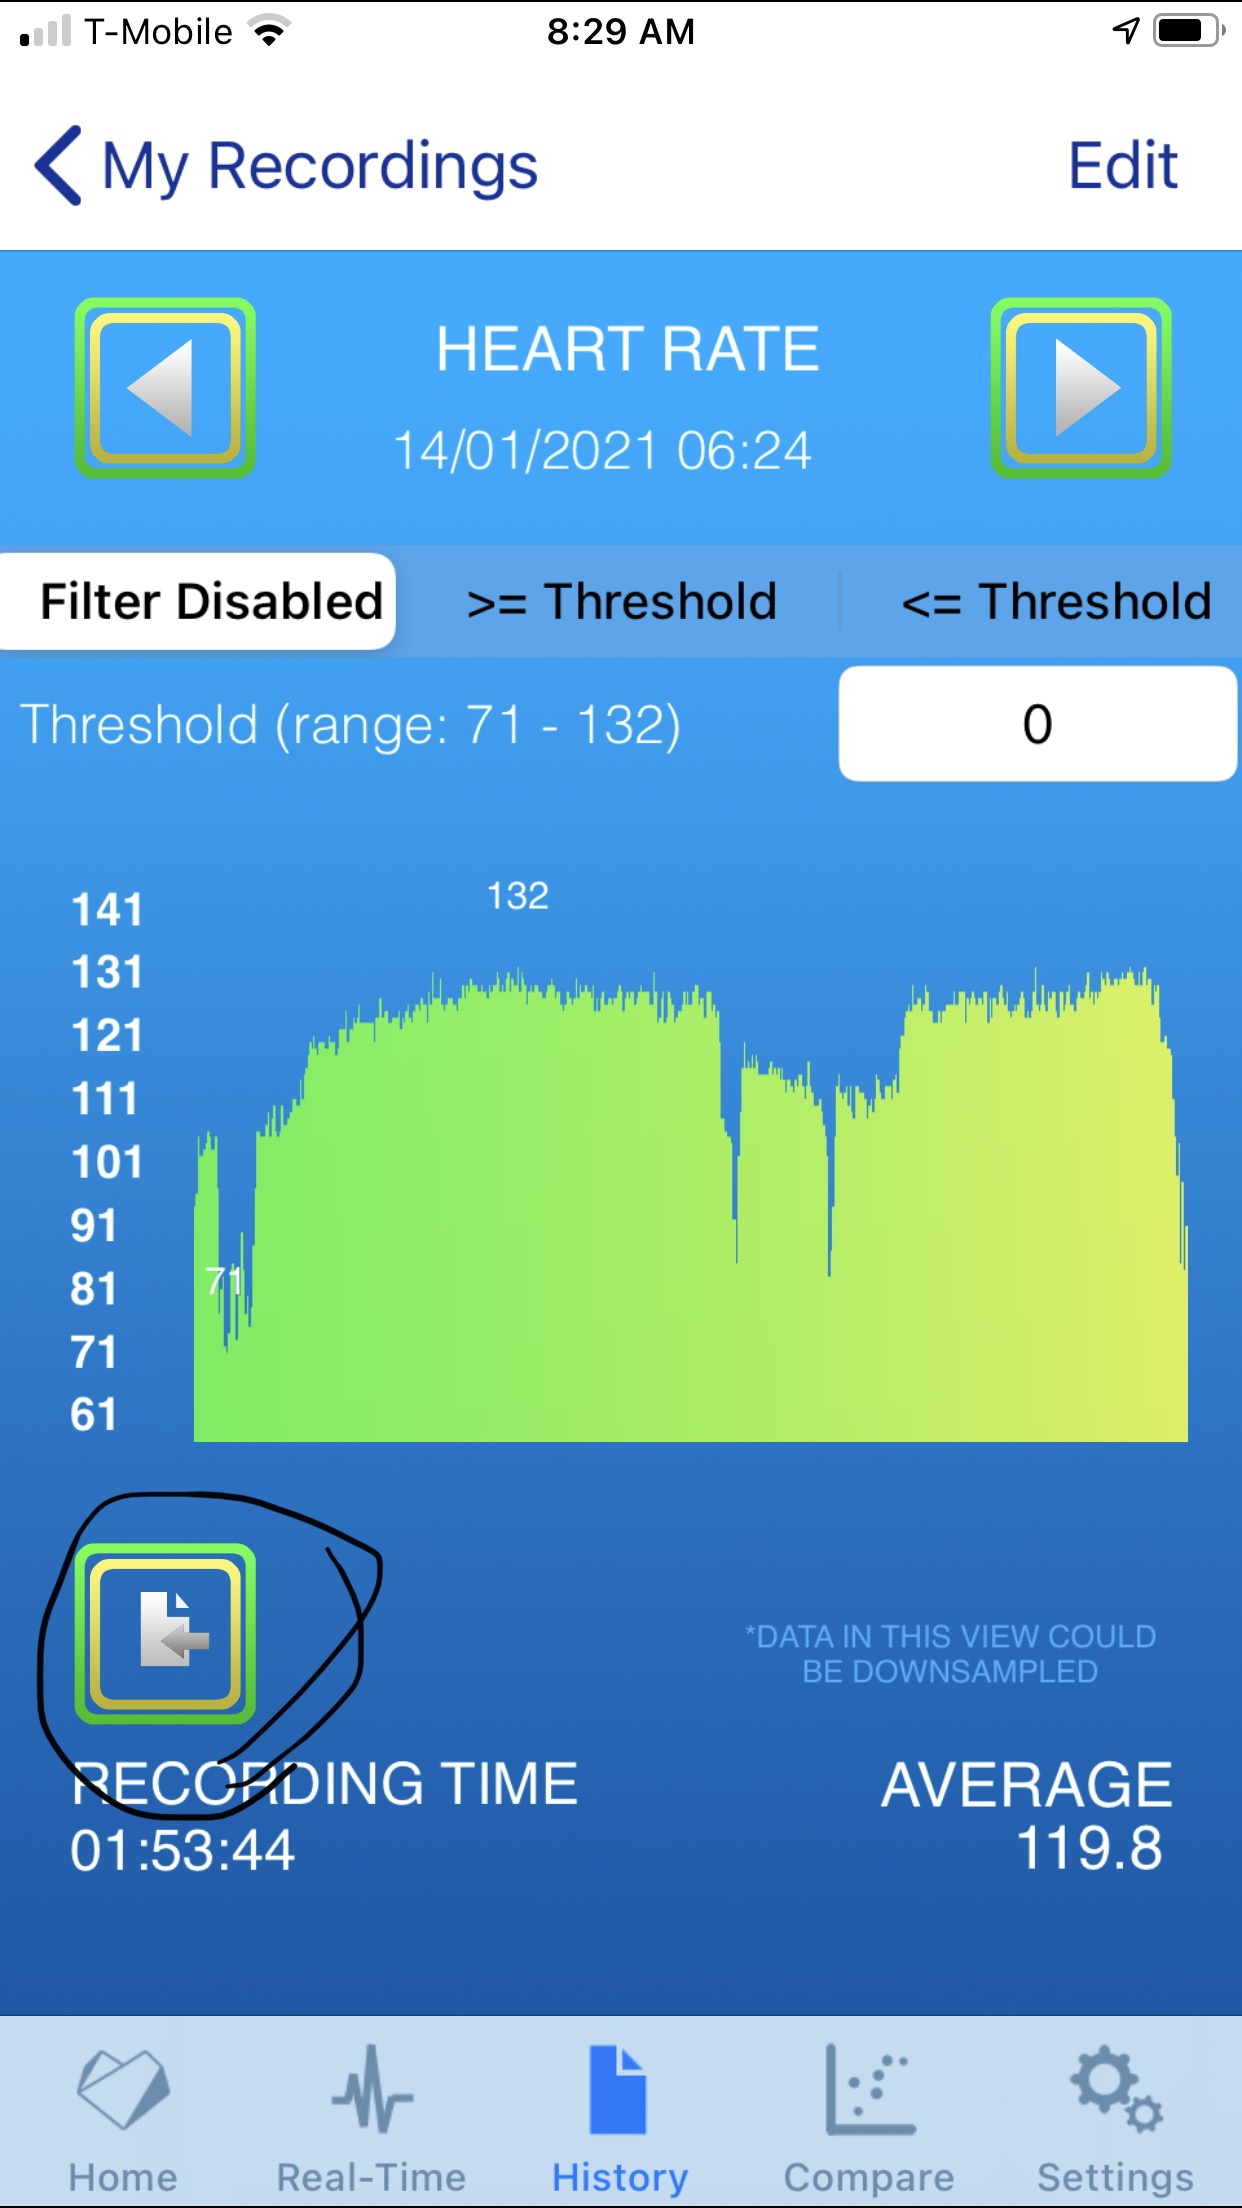
@carytb Are you using the HRV Logger app on iPhone? If so (and I was confused by this, that’s why I’m posting), it’s this button to export (right above Recording Time):
Apologies if you’ve already figured that out and it’s an unrelated issue, but I actually had to email Marco and ask him how to export. Didn’t even know that was a button to do anything. It will export three .csv files. You will want to look at the “features” one first.
Thanks - I managed to do it the first time but each subsequent attempt has met with abject failure. Still working on it.
Where do I get to this graph on Runalyze? Is it available on the Free account version, or only on the Paid version? Thanks
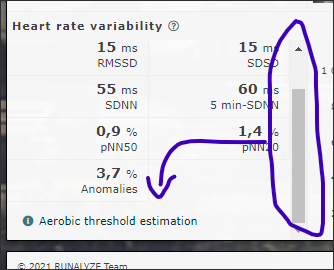
I use the free version. It’s a link at the bottom left of the HRV graph on the ride/run analysis page:
Thanks David!
I don’t see the “Heart rate variability” graph from my activity, maybe I’m uploading the wrong file. I tried to import the CSV files generated by HRV Logger but it doesn’t work. Which application are you using the capture the HRV data from your activity?
Thanks again,
It’s coming from Garmin Connect. Are you scrolling that left-hand control panel? The link is not obvious in the default view:
Check the changelog here: https://runalyze.com/changelog
It was added on the 13th January 2021.