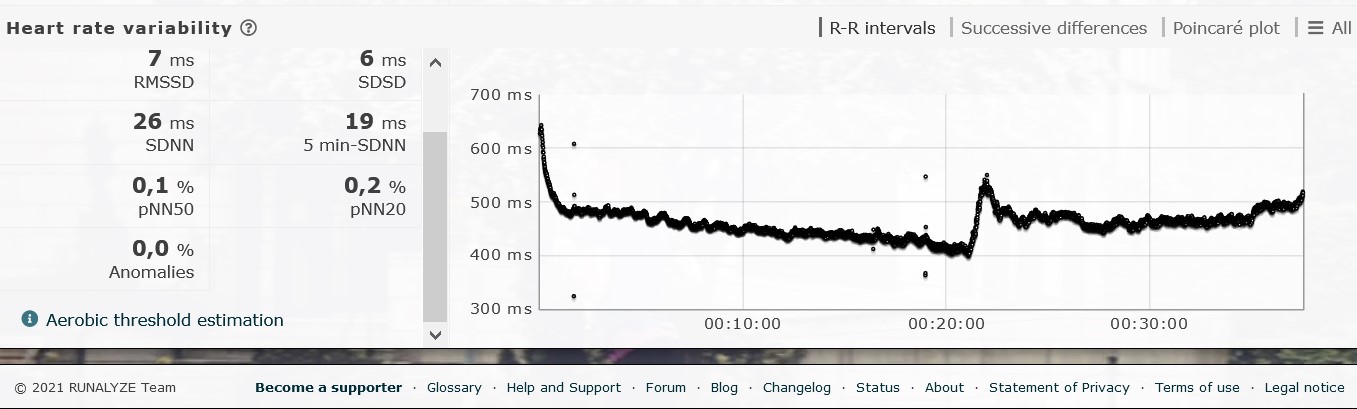
Thanks again David. I figured it out, my garmin (Edge 1030) wasn’t logging HRV Data, after I enabled it and uploaded to Runalyze I could see the HRV Graph.
I’ve downloaded Runalayzer and uploaded the 3 or 4 FIT files that I ran in conjunction with the HRV Logger and my H10 monitor. All of the files show a reasonably consistent Aerobic threshold with that set up (albeit it needed a little bit of interpretation). The Runalyzer however could only give a result in 1 case and that was higher than indicated using the HRV logger.
Looking at their blog post about the feature, they’re clear that the implementation might need refining. It might be worth giving them this feedback to help refine it.
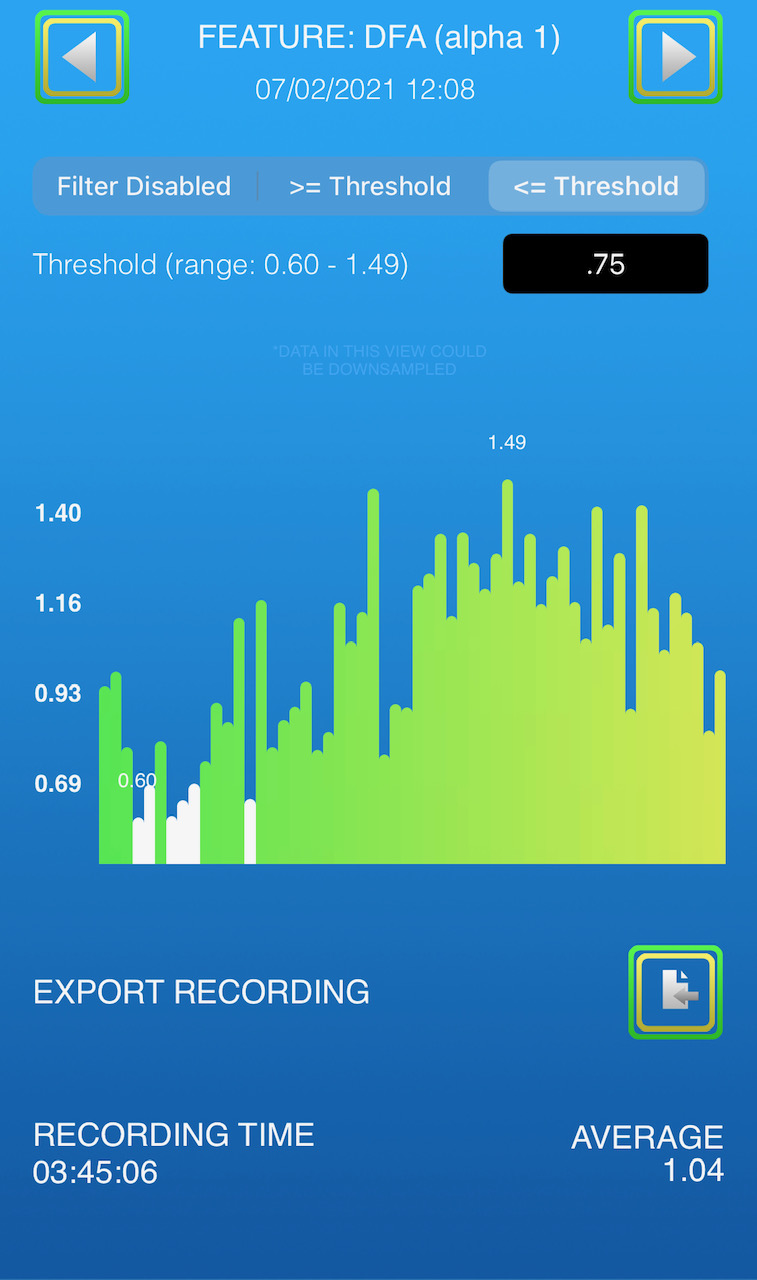
The use of real team HRV seems very intriguing using DFA alpha 1 on the HRV logger. However, I agree that there is much we don’t know about what the numbers and variations mean. For instance, why would my DFA alpha 1 go below 0.75 for a period of time, but then way above after some sharp sprint efforts?
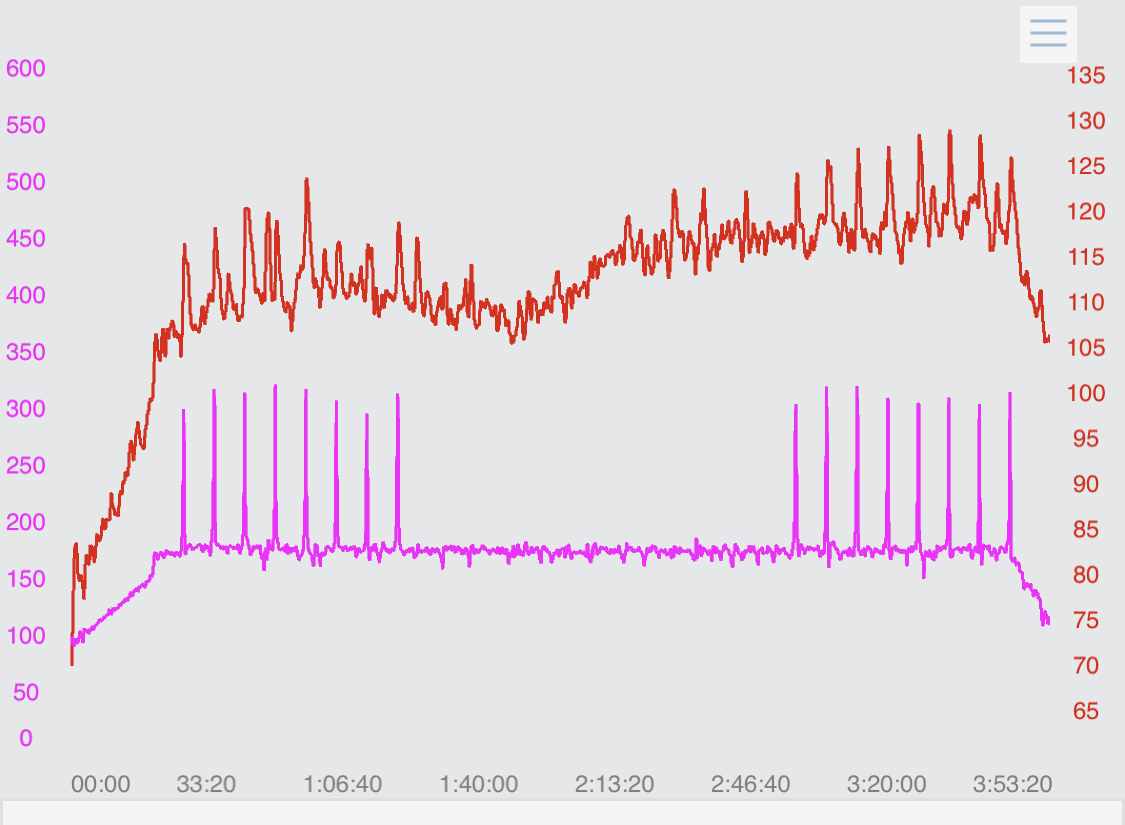
I doubt that doing some sprints early in a workout increases VT1. Maybe my aerobic energy system needs some good efforts to get kickstarted? The effort surely didn’t feel difficult in the first 20 minutes. It was actually quite easy until the last hour, but the alpha 1 was still quite high, though trending down at that point. I followed Trevor’s advice and went another 45 minutes or so after it got hard.
As of March 18, HRV Logger has an android app. It is in the Google store, $12 US. I played with it today and was able to get some data to play around with. I adjusted my test protocol and will play around with it again tomorrow.
3 Likes
I tried this out for the first time yesterday on an indoor ride
I have a Polar H10. I downloaded the HRVLogger (IOS) and set up a workout on my indoor trainer. I ramped up in 4 steps of 3 minute segments to Sweet Spot and then, starting at 50% of FTP for 6 minutes, successively increased the power for each 6 minute interval by 5% until I got to 80% of FTP. I monitored the DFA (alpha 1) on my Apple Watch. At 75% of FTP my DFA hit .75 and then 2 minutes later was .66. My HR was much lower, 115, than I had expected it would be. My outdoor HR at FTP is 140. It will be interesting to experiment with this outside.
I tried this out on a 36 mile outdoor ride today. It was a group ride but at a conversational pace on a fairly flat route with light winds and moderate temps. I was one of the stronger riders in the group and was careful to not push the pace.
I was surprised that my DFA (Alpha1) only dropped below .75 3 or 4 times with the lowest at .51. Most of the ride my DFA (Alpha1) was well above .75, When I tried this out on an indoor ride yesterday my HR around .75 was 115. On today’s outdoor ride my HR was around 120 -121 for a .75.
I look forward to trying this out more. The number of artifacts removed for each two minute segment was higher than I expected. The highest was 35 with a quite a few in the range of 17-24. TrainingPeaks reported that my average HR for the entire ride was 119.
1 Like
I am wondering if the difference may be due to the 2 minute gaps between updated results of DFA a1? With the HRV Logger app in the way Marco suggests to use it it only reports a value every 2 minutes which seems rather long for highly changeable metrics like HR? I am wondering if anyone has found an app that report DFA a1 more frequently and records it in real time so you can view it as you do a workout? I have also tried HRV Logger but instead of steps I did a slow ramp of power over say 20-30 minutes and the result was quite interesting and in line with my expectations except I had to interpolate to find the point where DFA a1 was 0.75 because it fell between one set of 2 minute readings. So for real time free ride data the 2 minute window seems way too long.
for those interested I did find a way to do this that seems to work well. If you do a ramp type test 50% FTP to at say 90% either stepped or smooth progression (roughly 5 watts per minute per Dr. Rogers). You can record HRV with the app HRVLogger. This records RR data every heart beat. This file can be downloaded. The on line app Runalyze will allow you to merge the .FIT file with HRVlogger RR data and then like magic you can see a plot of DFA a1 vs power and the plot will report the aerobic threshold from the data. So far looks good. I thnk Dr. Bruce Rogers has checked out the Runalyze output and it is in reasonable agreement with the Kubios program which is the gold standard it seem.
Funny there is not more buzz about this method on this forum.
3 Likes
What kind of difference have you found between showing more frequent data points vs. the 2 minute gaps? Do you have charts for these by any chance?
I haven’t had much of an issue with 4 min stages and 1-min updates to DFA a1, so curious on what you’ve noticed with more frequent recordings.
In a similar vein, what are potential issues with using 30 seconds as a sample rate? It gives output; but is it actionable insight?
To be honest at this point I do not have enough data to really tell if there is a difference but the on line app Runalyze allows one to merge data from HRVlogger into a .FIT file. This then allows you to change the data gap, their standard is 5 seconds. I have just started down this road but the data from Runalyze is very interesting. I did 2 very different workouts, one a simple gradual increase in power (on the trainer) from 50% FTP to 90% and another where there was ups and down then up to 100% FTP, hold for 3 minutes then back down.
The Runalyze algorithm came up with exactly the same aerobic threshol d for both activities.
There two different things at play, one is the time span for the DFA analysis the other is the reporting Frequency, There is literature that indicates for the DFA a1 the minimum time to get a good result is a 2 minute time span. This is purely based upon mathematics. When you do a DFA analysis you are actually doing a type of spectral analysis. The type of data you are looking at is fractal in nature and the DFA a1 is a form of slope of the data analyzed as I understand it. The math is way over my head. So the best data is generated from a 2 minute minimum tome window. The second point is reporting frequency. That can be anything from about 1 second to anything you want. Because it takes a 2 minute window your first reading is at 2 minutes (this is sort of like normalized power taking 30 seconds to generate a reading) but after that first reading you can generate a new reading for every ne RR interval recorded so let’s say 1 second for arguments sake. My feeling though I have no data at this point to support it is that if you only have a reading every 2 minutes that is very heavily smoothed data, whereas every 2 seconds is just slightly smoothed. Again analogous to having power readings every second or 3 second smoothing. It may miss a peak but it is easier to look at. DFA a1 tends to be less stochastic so that may be why wider smoothing and interpolation works but I am not certain at this point. My personal preference is a 2 minute window with a 2 second reporting frequency. That just makes me feel better about the data. In other words a saw tooth pattern vs a smooth curve, from the same data set. I prefer the latter.
not a lot of data but what I see in one very straight forward ramp test is as follows:
2 minute window, 5 second reporting interval. Runalyze does what appears to be a least squares fit line through the DFA a1 vs power to determine the 0.75 data point and reports 137 watts. Same data set but change the reporting interval to 2 minutes, the reported aerobic threshold is 147 watts. This makes sense due to the sparse data set and the influence of the points on the fit line.
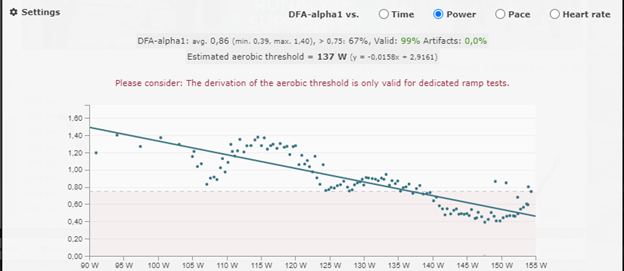
As you can see there may be a difference if you run the analysis on 2 minute reporting intervals vs 5 second reporting intervals.
Have you seen the feature in Runalyze where you can exclude a batch of data points so you can just get the ramp portion that passes through 0.75.
I simultaneously record to my Garmin when I’m doing this on my turbo. As it links directly into Runalyze I don’t have to mess about merging files etc. Just got to make sure you are recording HR via Bluetooth on the Garmin as it seems to default to Ant+
no I was not aware of that feature. I think though one has to be careful in how one assesses DFA a1, but as noted earlier it is early days and there seems to be a lot to learn.
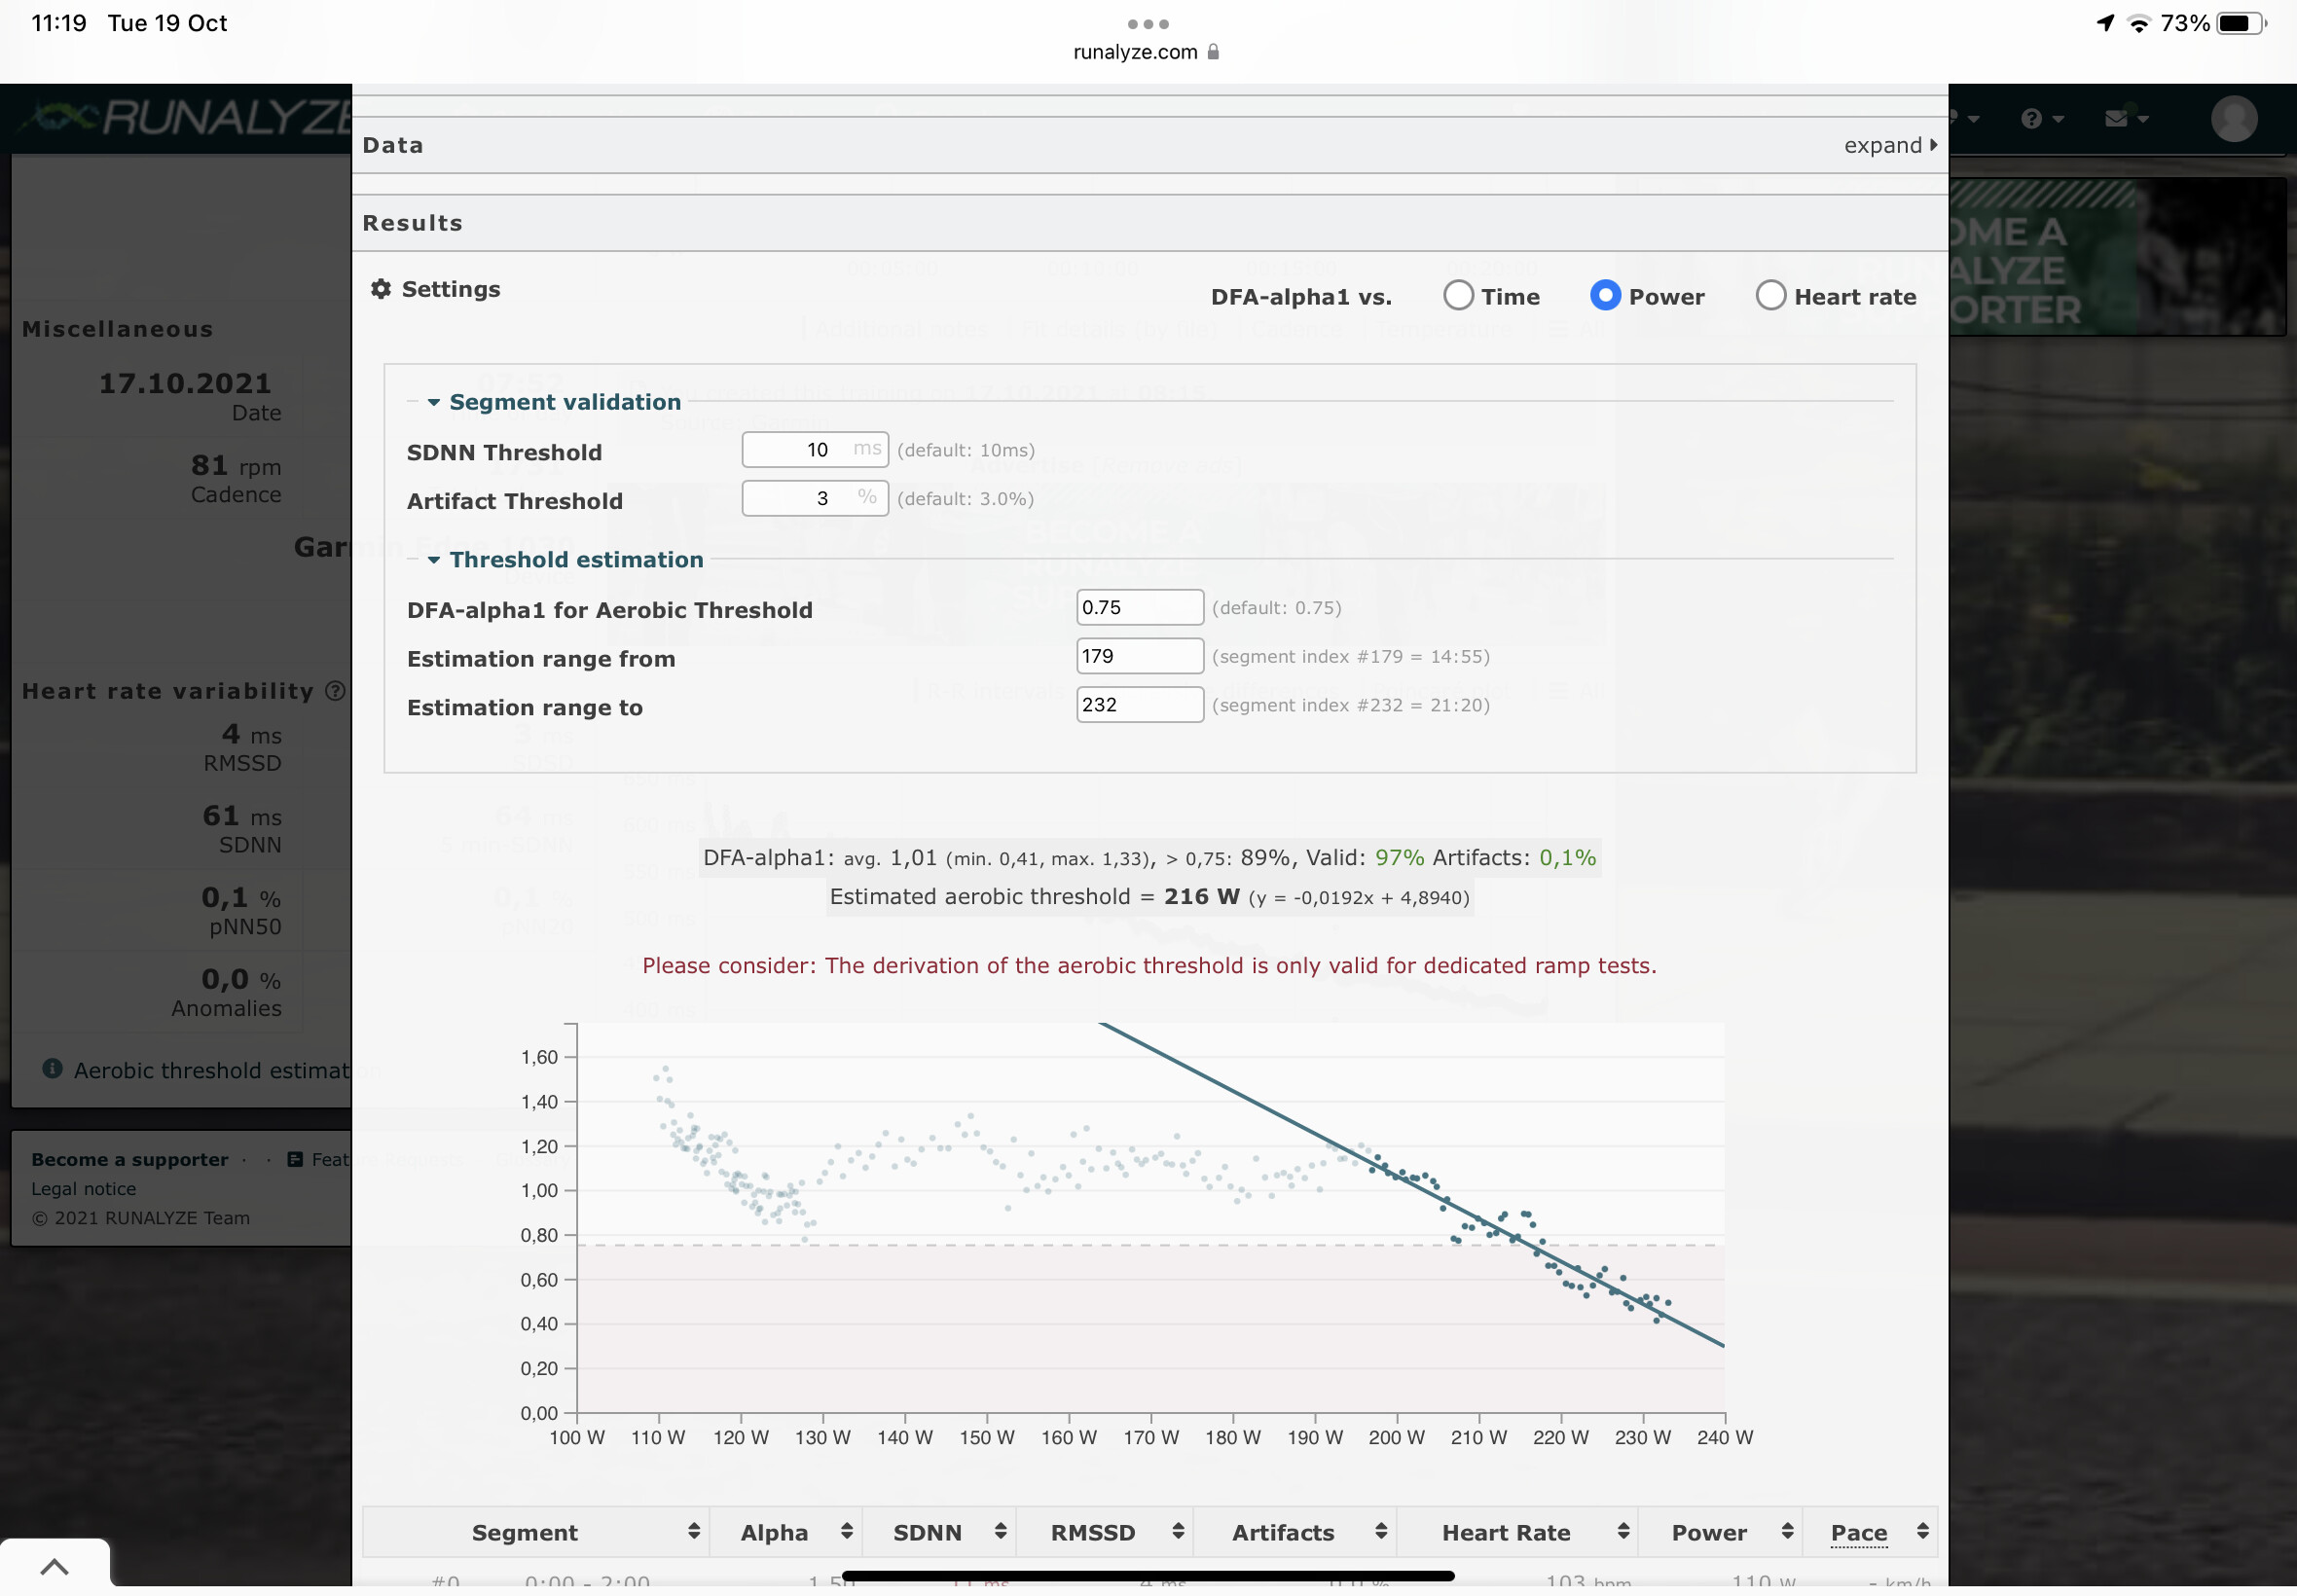
I agree. I think there needs to be a fair bit of interpretation of the data. For instance. On that graph I appear to bit just above .75 for a number of the points before rising then dropping quickly. Looking at that power level gives me approx 200W rather than 217W which I feel a more realistic figure.
1 Like
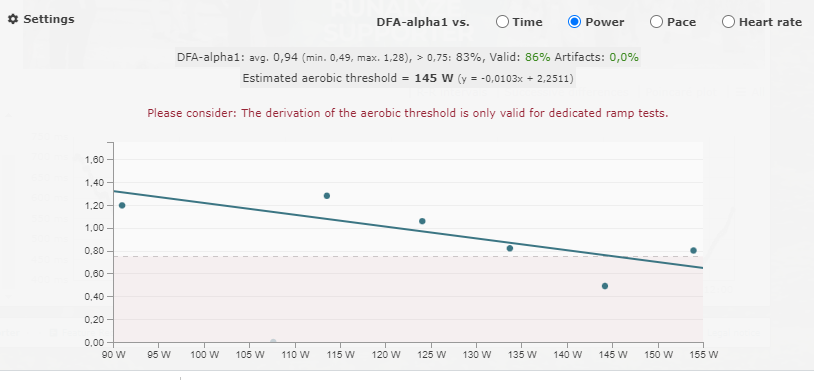
What is interesting is when plot the linear ramp part of my workout it seems to hit a very similar threshold as a dedicated ramp test.
Also of note Runalyze does a least squares fit of the power vs DFA a1 and is not based upon timing. So it looks at all of the times you “hit 0.75” as an average within the test range. So it is a scatter plot and if your DFA a1 dropped past 0.75 multiple time in the data set then it will not assess a single point but rather the trend line average. The threshold is calculated from the least squares fit line using the equation y= mx * b then you can calculate the threshold and is what they have done. In this case since x watts is the unknown and y= 0.75 is the known, you rearrange the equation to solve and get the answer 215.83 watts. That is why it is different from a single point when you crossed the 0.75 point. Or more simply it is the point when the solid least squares fit line cuts the 0.75 plane. From that graph you can see it is around 216.
1 Like
I’ve been experimenting with DFA a1. I approached differently than you guys. I went by heart rate. (This seems more logical to me than trying to couple it with wattage.)
I set up the HRV data logger on an ipad and had my Polar H10 connected. The H10 can connect to two devices so I also connected it to my Garmin head unit to record the session.
I did steady state sessions on the trainer. I slowly ramped up my heart rate until I crossed the .75 threshold and then I backed down slightly and then tried to get the data points to surf right under .75 threshold.
The test confirmed my estimated aerobic threshold was right on the money. A long time ago I chose 120bpm which was based on Seiler’s 60-70% of HRmax estimate. I had also confirmed 120bpm with the talk test. DFA 1A was right on this mark with a couple of exceptions.
One time I was well rested and I could ride with my HR close to 130bpm and keep it under the .75 threshold. Another time I was fried and even at 120bpm I was going over the threshold and had to back down to 115bpm.
2 Likes
I think this heart rate approach will likely be better.
Do you have the data from one of your heart rate step tests? I would like to import it into my software.
I would need the fit file (power and heart rate) as well as the hrv data file (can be a csv)