I am wondering whether a 3-minute all-out test can be used to determine:
a) the energy systems used
b) the fiber types used
So that you can steer training → go for so many watts to target fibers I / IIA / IIB
I find the research / articles a bit unclear on these questions. Interested in insights.
@stevenneal: what is your experience with the tidal volume in the 3-minute test vs ramp test?
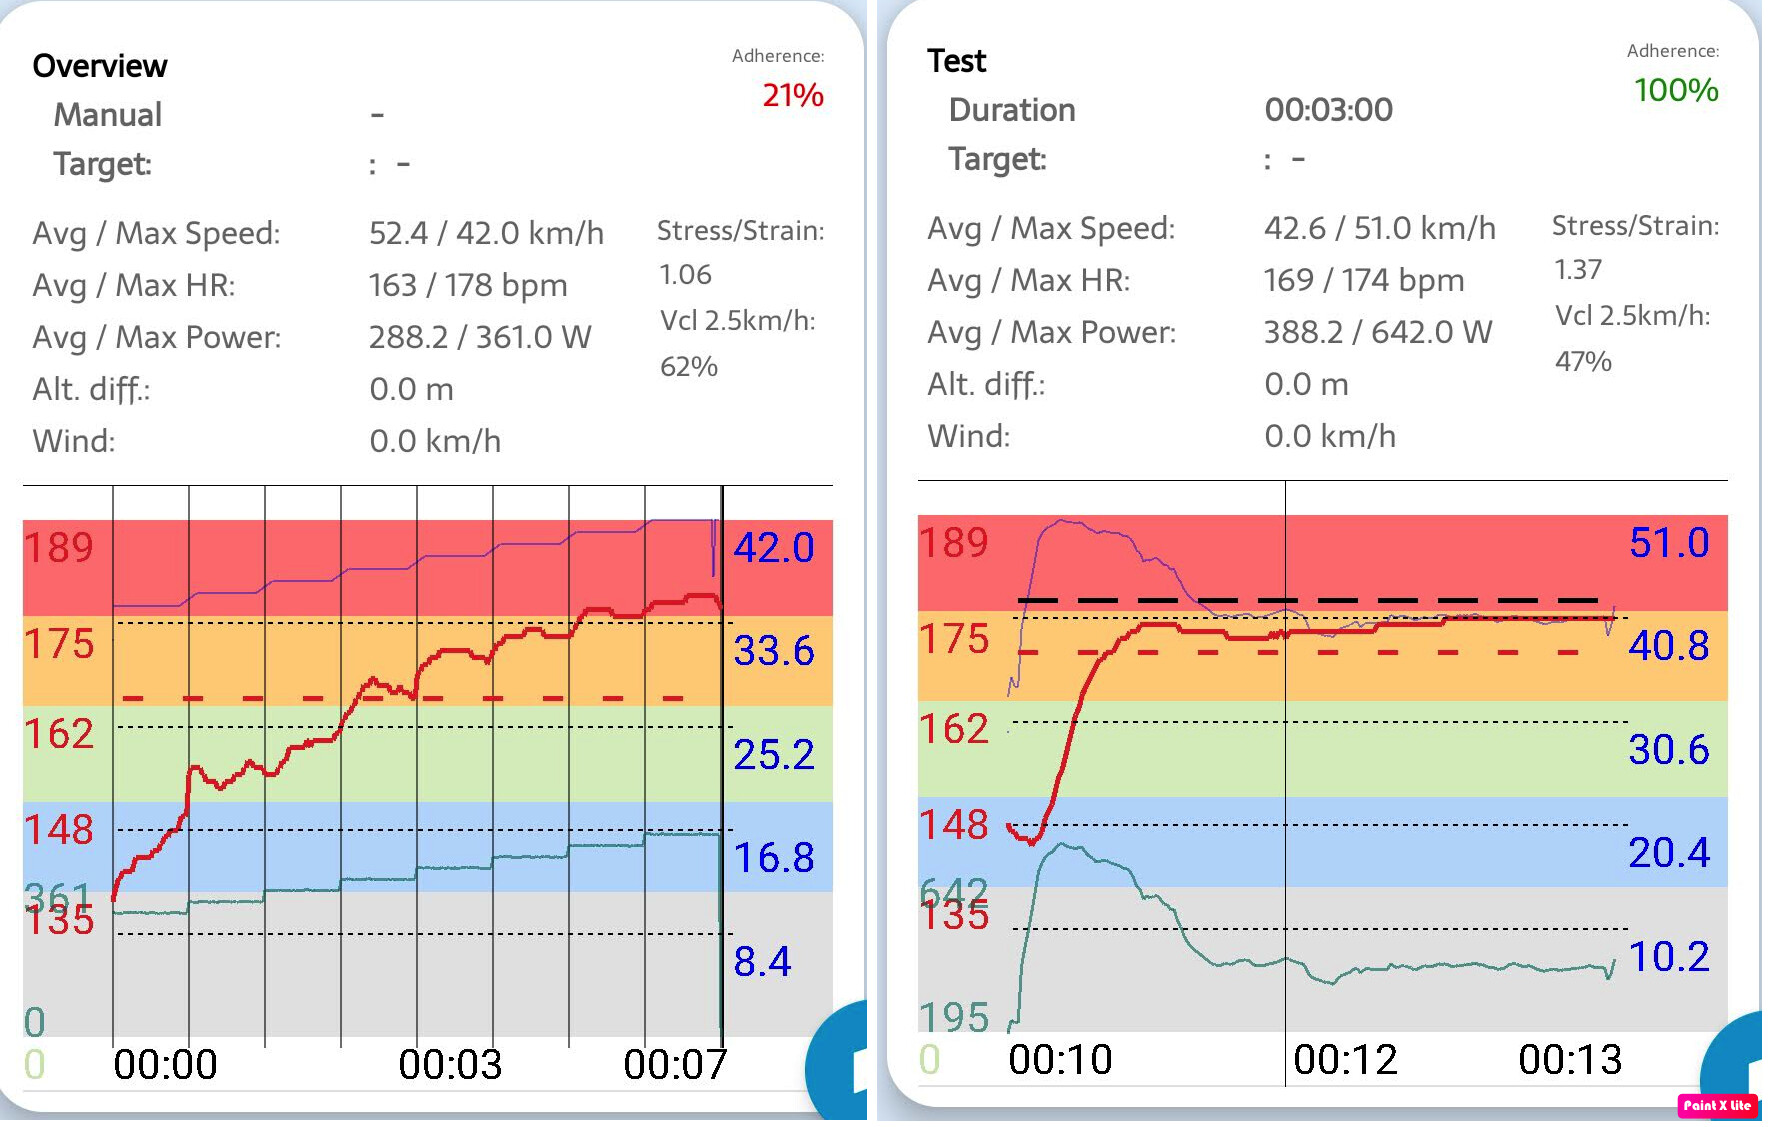
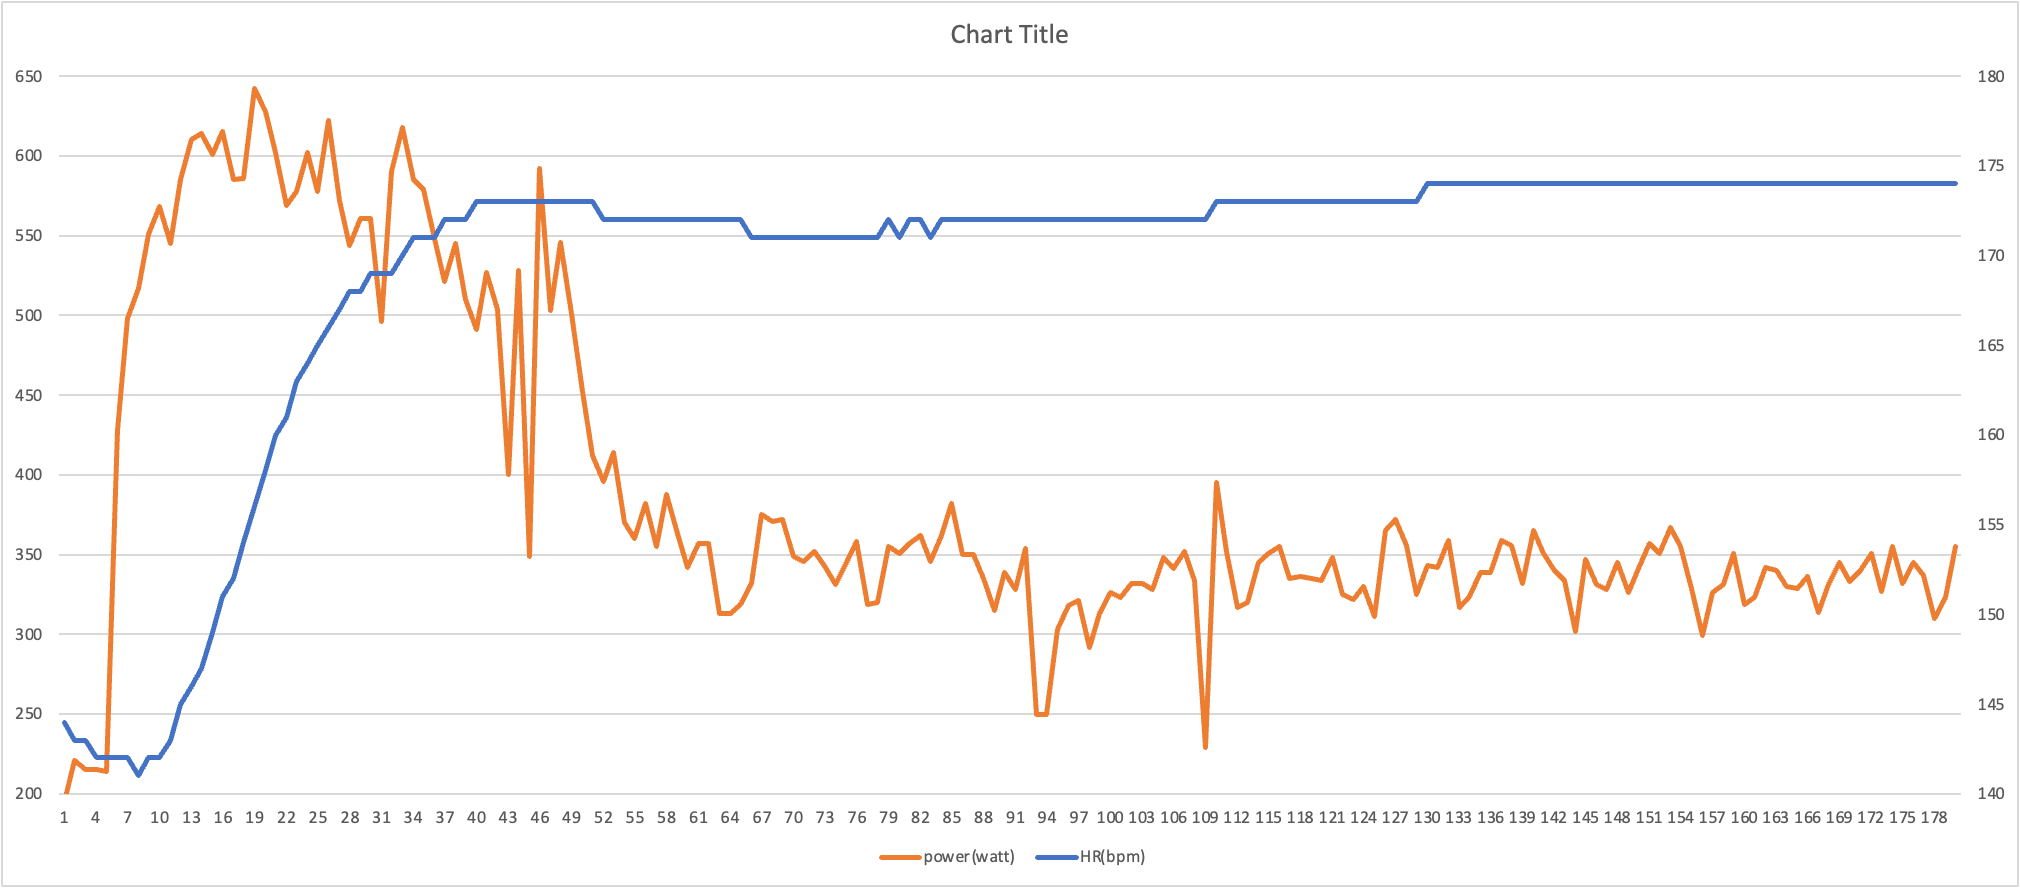
I just completed a 3-minute test and observed that I was breathing very heavy for a longer period of time than during my recent ramp test. Heart rate is also showing a totally different curve. According to my lungs the 3-minute test was more demanding.
Interesting to see is that my last 30sec average power was 336 watts. That is ‘1 step below’ the last completed step of the FTP test. I am inclined to conclude that the last step of the FTP test included an anaerobic contribution.
For the sake of illustrating:
RAMP (left) versus 3-min (right):
I haven’t got any data on time trials like that, only step test data. Keep in mind that everything I discuss relative to respiration is NOT Tidal Volume but in fact Tidal Volume % - the athlete FEV1 (amount of expired air in 1 second) in litres / divided by the Tidal Volume in Litres during work in their sport.
The reason for this is that the actual FVC or forced vital capacity doesn’t matter with a low FEV1, what matters is the amount of air they can forcefully expire in 1 second so that they can breathe back in. This becomes more important the higher the breathing rate.
It is like increasing threshold relative to vo2 peak. If you can increase expiratory strength during your sport, while maintaining deep breathing you can then use more of your forced vital capacity (amount of air moved in 6 seconds).
So when you look at a metabolic test and only have Tidal Volume during work, you can’t tell as much as you can when applying FEV1 to this data.
If you lived close I would let you smash out a 3m test and a step test on my cart I don’t have the capacity for this at the moment, and likely won’t for some time.
Here are a few quick examples.
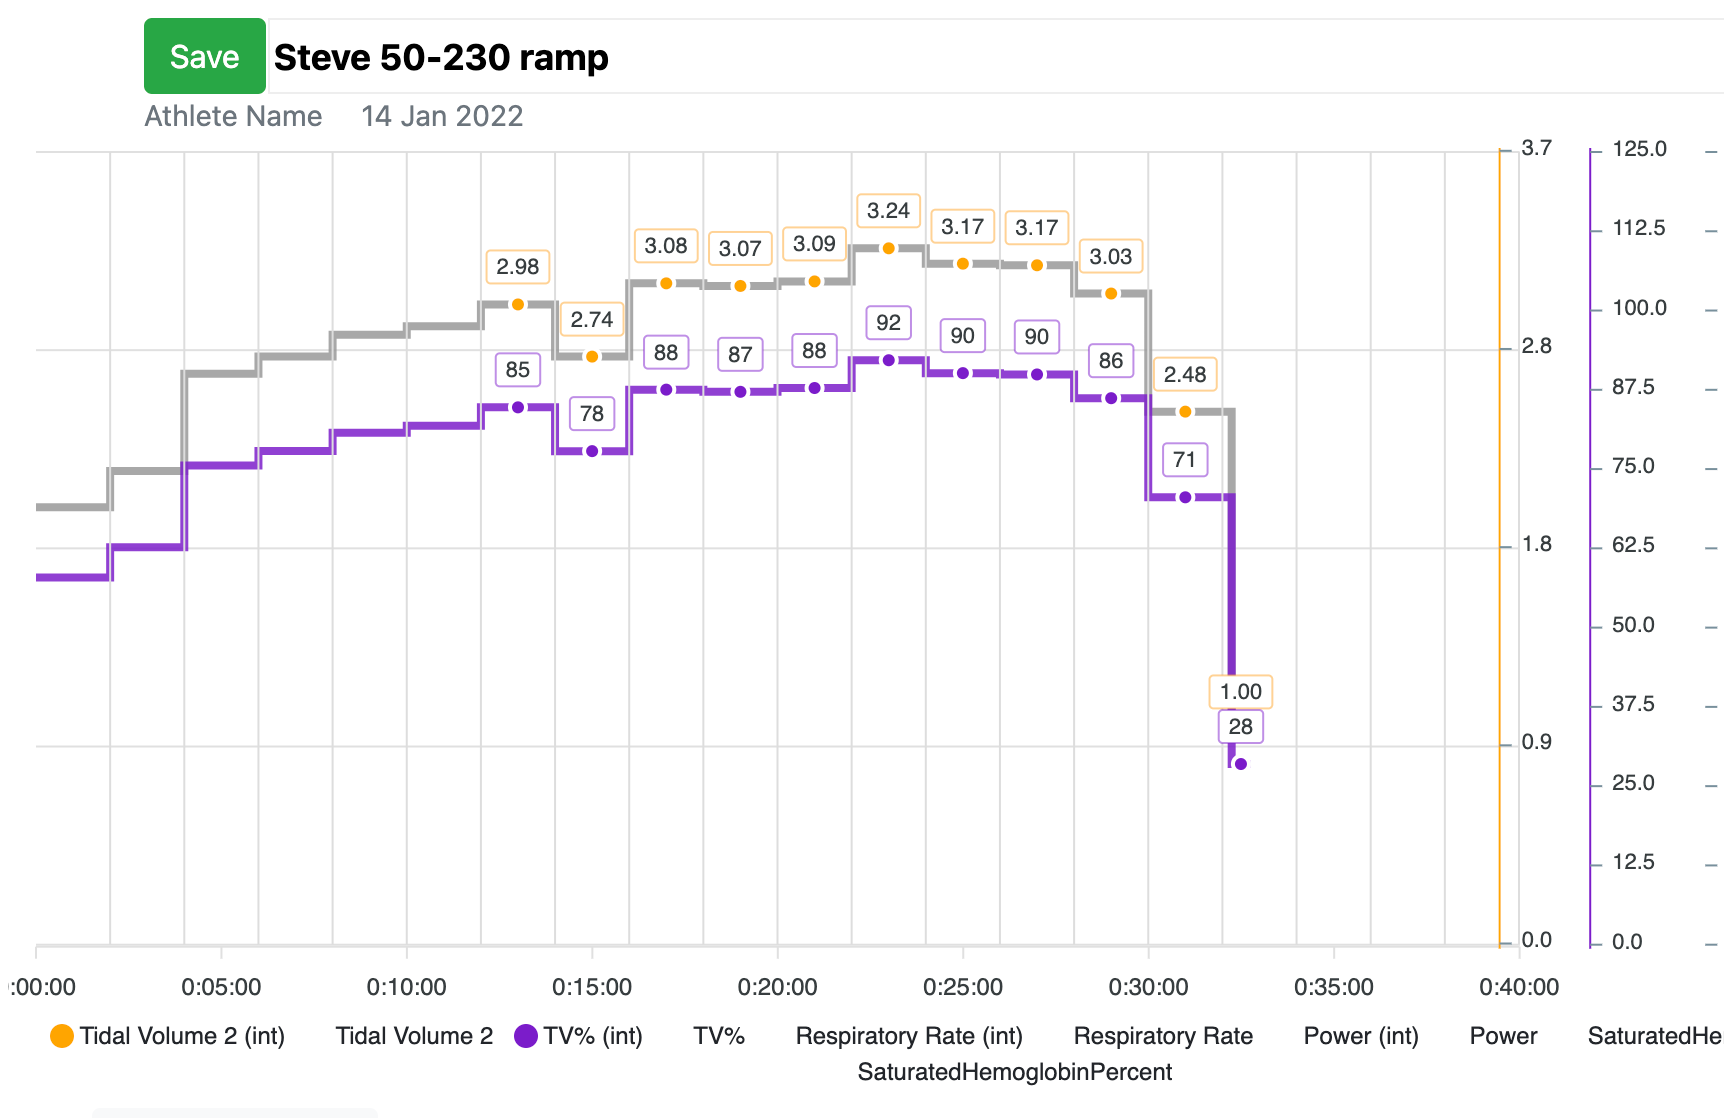
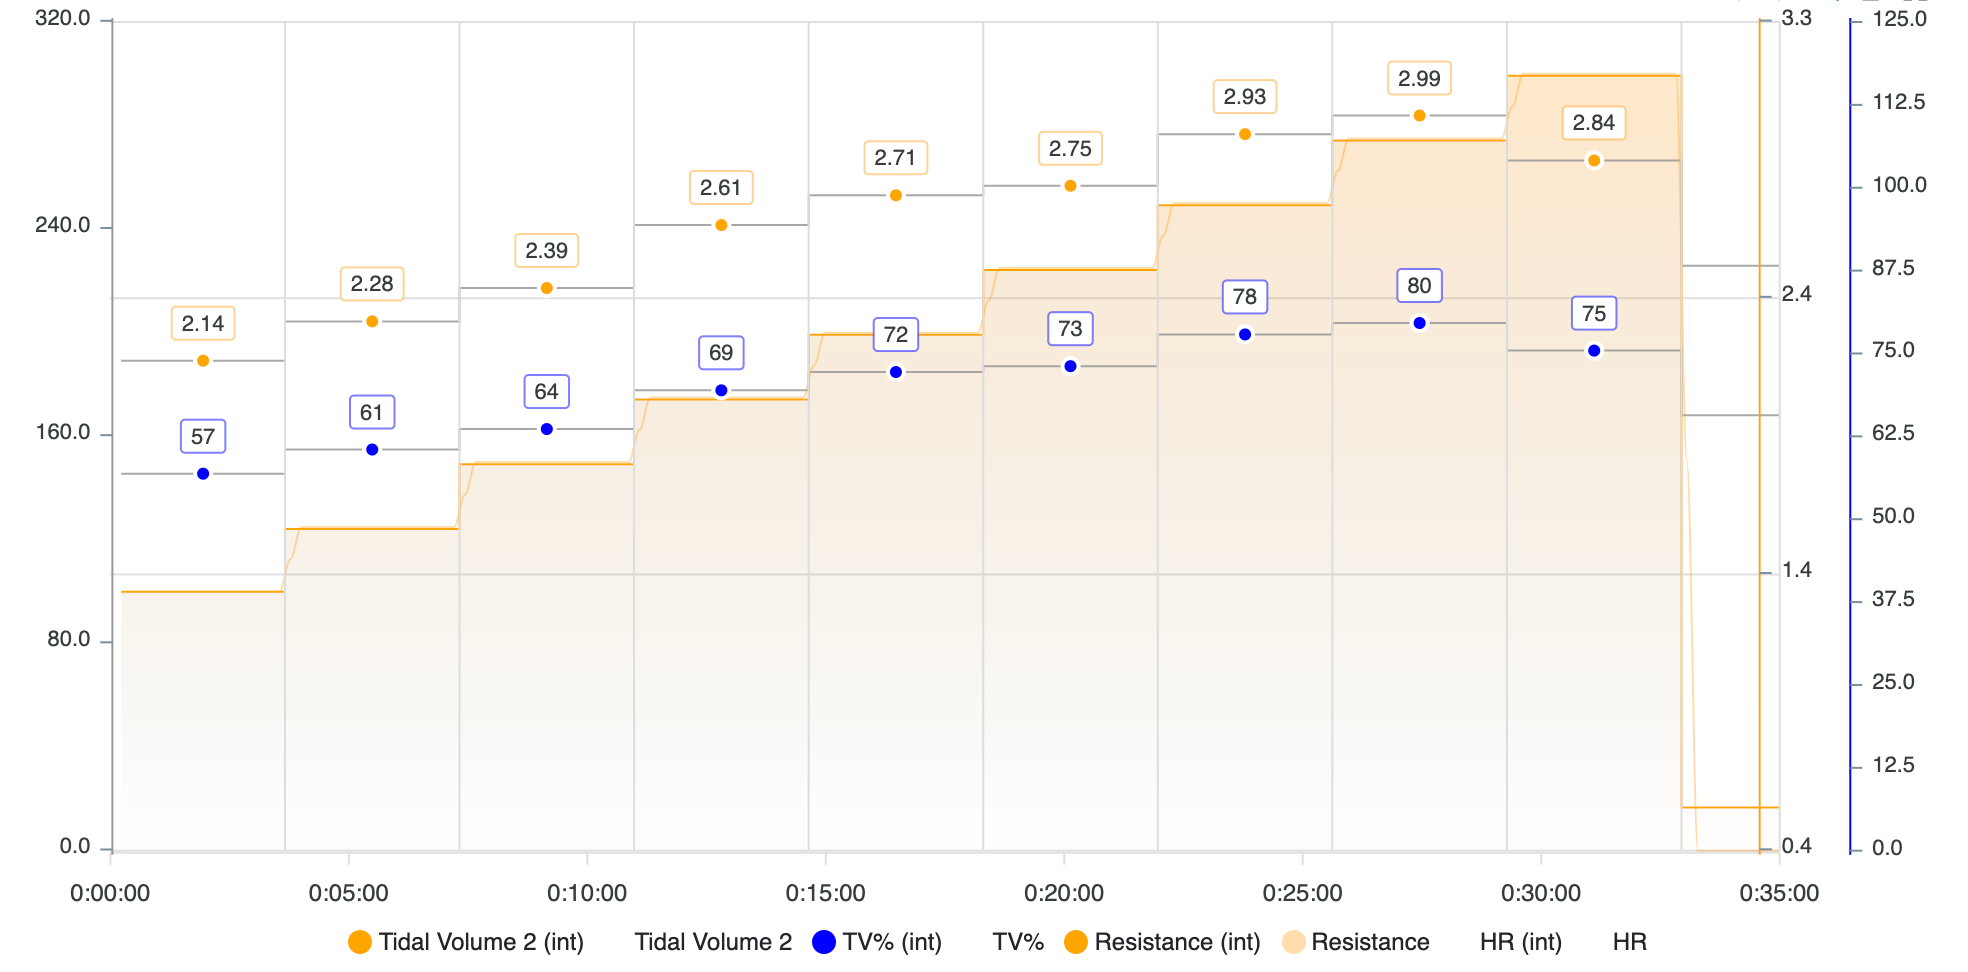
One athlete 53 FVC 4.98 FEV1 3.52 , the other 51 FVC 5.14, FEV1 3.76.
53 year old athlete (me, even with lower FVC and FEV1 the actual tidal volume during cycling is higher. Also note the difference in TV% between the two. Sorry my software glitched on my file getting this fixed but I think you will get the idea of the difference between the two.
I would be interested to go read up on some research about this, ill dig around and see what I can find but if you know of any let me know. I have noticed the Brandon McNulty does a 3 minute effort every couple of weeks in the early season but it does not seem to be an all out effort.
(If you want to see the efforts he did I see one on the 7th of Dec and the 16th of Dec, both steady and at the same power. Wonder what he could be tracking with these.
Thanks @steveneal for sharing the background on TV as well as the examples.
I recognise the theory from my swimming years, where failure to exhale +/- 80% of TV results is lower performance because you restrict your aerobic capacity.
@Thowe: i could not find much when searching for 3-minute test. Perhaps there is another name for the test that i do not yet know of.
I found the test because i wanted something that would tell me ‘max power’, type I+IIA power and type I power. That would help to set training targets for developing specific fiber types.
Of course, there are other ways to accomplish the same, for instance by measuring lactate.
Wonder what he could be tracking with these.
You can track your max power and aerobic power (where the output is steady).
If you do this regularly, you can see your changes in both anaerobic and aerobic output.
A ramp test will primarily tell you the aerobic output.
A Wingate test (30 seconds all-out) looks like the 3 min, but is fully focussed on anaerobic power and doesn’t show the aerobic part.
I don’t know if tis would be of interest but Dr Mark Burnley was one of the scientists who validated the 3 minute test as a proxy for critical power. I’m not sure i’ve got that completely correct but they guy knows what he’s talking about. This from his excellent YouTube channel on exercise physiology. @trevor - might be a good guest on FastTalk in the future