I’ve used both those apps and they have given the exact same point for crossing 0.75 in terms of HR. The protocols all suggest long steps in any ramp test so its clear it takes time to respond, just like lactate tests. FYI, its well into my z3 heart and power zones which surprised me as I expected it to fall in z2. I’ve since heard the same from quite a few other people.
I haven’t, and wont, do any lab tests for confirmation and will use this as a guide for a LT1 ceiling and perhaps some fatmax work in future. When I’m stuck indoors on the trainer and its not a day for any kind of intensity, I think its a handy guide to understand where I might target some 90 min tempo rides for max impact.
Today I did a slightly different protocol with this. I did a 15 minute warm up to the steady state heart rate I wanted to try. I then did 30 mins as steady state as I could. I intended to look at Fatmaxxer DFA1 in real time whilst cycling in turbo but phone turned screen off and it was out of reach.
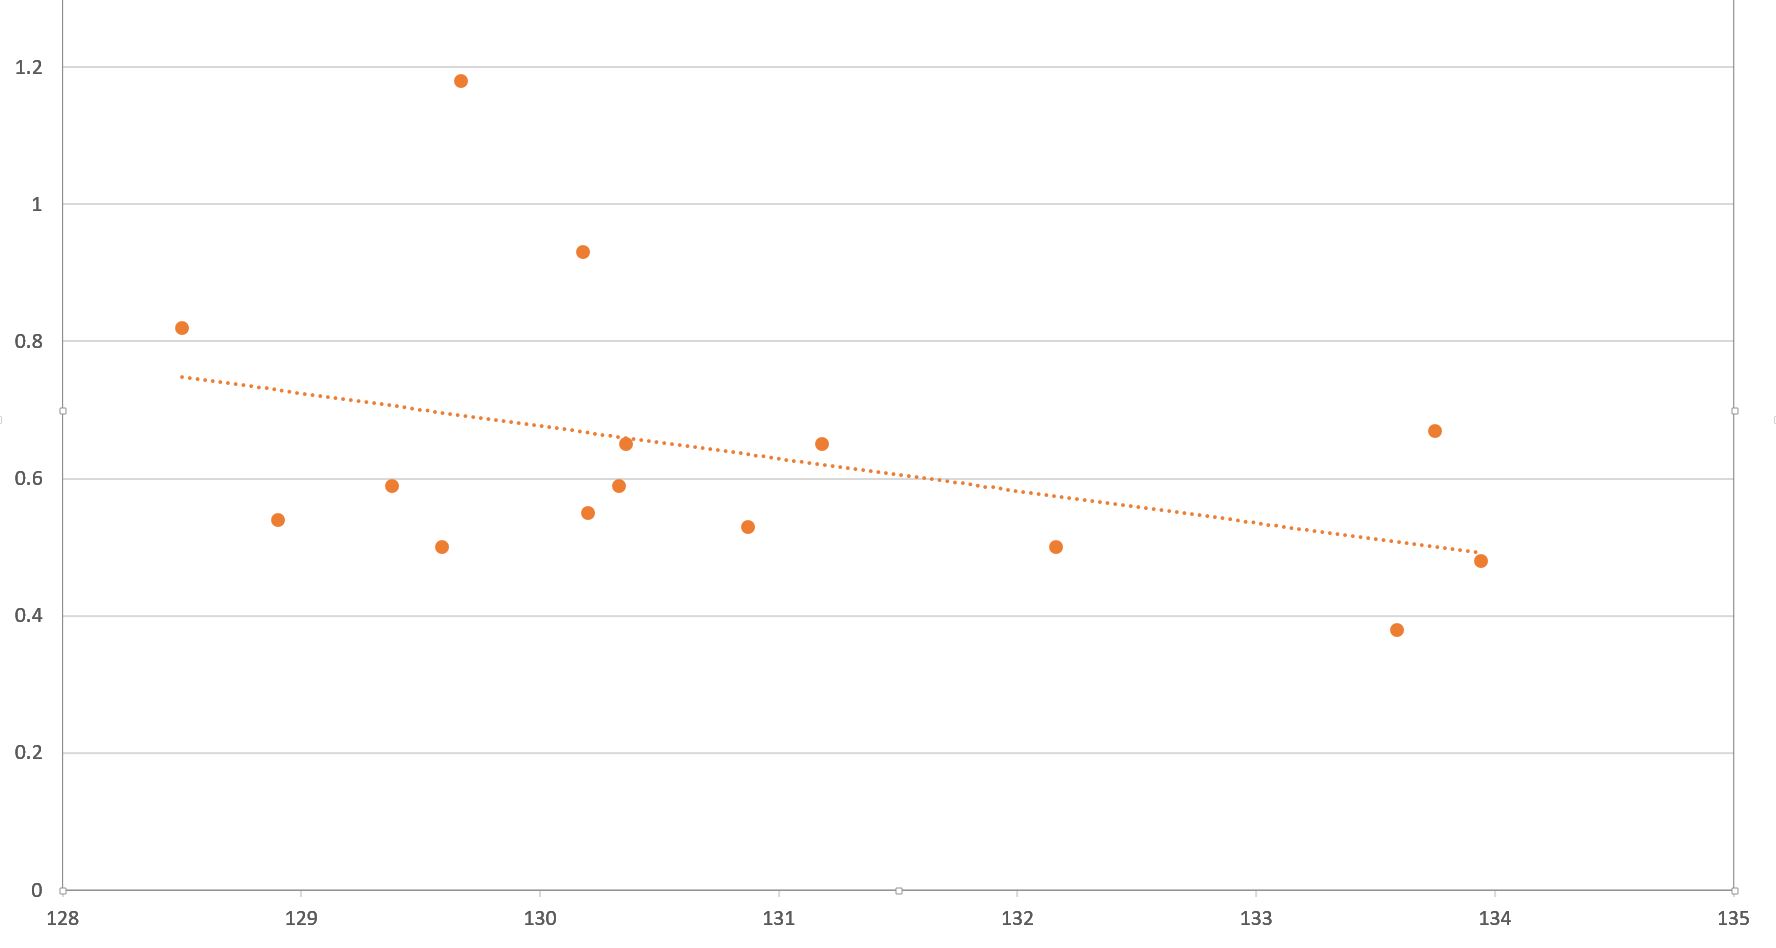
A heart rate of around 130 bpm was too high for a DFA1 of 0.75. The graph looks like wide range but it’s only 6 bpm difference. I came up averaging around 0.6 for DFA1. I’m going to repeat the process tomorrow morning with a target steady state of 125 bpm. I’ll also change my phone so the screen doesn’t turn off and I can see it in real time.
I know it was around 135 - 137 bpm a year back. Looks like some long easy rides are in order to raise LT1 again.
start at 50% max heart rate, this will be very low wattage, don’t worry about it.
then increase 5% every step.
Try and keep the heart rate plus or minus 1% of the goal heart rate.
Try and keep the cadence as steady as possible between 80-90 if possible, but worry more about the heart rate than the cadence.
Once you are done please share the fit file with me.
Find me as a coach on intervals.icu as well.
hit the lap button at the beginning and end of each step, yes your power will jump a bit as you try to increase wattage, but it will settle and all work out.
I assume this is done like a typical power step test. Continue with the 4m steps until we can no longer maintain the required heart rate within 1%. Once complete, does this give us an estimate for Aerobic Threshold and Lactate Threshold?
actually it is not exactly a typical step test. The references above from Bruce Rogers suggest that you go to exhaustion though I see no reason it will not work as long as the ramp rate is in the right range. There is still work to be done to confirm the second break point of DFA a1 at 0.5 though there is reason to believe this is the second threshold.
The basic answer is:“Just perform a typical ramp of 5 or 10 watts per minute”. I have tried both a stepped approach as well as a smooth (unstepped) ramp and the results are very similar. Yes you want to use erg mode in my opinion. You do not go to exhaustion for the AT1 that is your lower threshold and should be where you are riding “easy”. The point is for you to know where the boundary is for those easy rides. This break occurs at a DFA a1 of 0.75. The second break point is the boundary between aerobic and anaerobic threshold at a DFA a1 of 0.5.
For anyone coming across this aerobic threshold detection method (Alpha DFA 1). I just went through the process using HRV Logger and then came across a new blog post dated 14/3/22 by Marco Altini in which he concludes:
‘The universal threshold of 0.75 does not identify the aerobic threshold with reasonable accuracy at the individual level’.
It’s worth checking out the full article for more details. Hope this helps.
I don’t think it is useless, but it is something like the 220- age HR max… it is not universal, but at the general level it works OKish… so though for me the 0.75 limit may not work then again neither does the 220- age for HR max. I think at the root it has some utility but at the individual level may need some further study and refinement. I agree with Marco’s point they should have removed outliers from the data, there are statistical methods to do so which may have made the process show what Marco is noting that once the extreme values are removed the correlation is poor. If you use HRV Logger one short coming there is unless you check the data in another program the 2 minute reading to reading output is not good for the purpose, however it does record the data and if run in another program then you can see much finer detail. The otehr thing with DFA a1 is that it is determined by previous research that a 2 minute window is best, which means that the data is heavily smoothed, ie if your heart rate is 140 bpm, then you have 240 data points that are used to calculate the DFA a1. That as well may impact how the method reacts to changes, ie it needs to be a fairly significant change to move the result, though the math is way over my head for calculating DFA a1. So this is a neat new thing but it may be a while before we know if it works and how best to utilize it.
Hi all, just coming back to this topic with a question more than anything but also a thought. DFA a1 is a calculation that takes a 2 minute window of data to produce the result(2 minute windows are the standard default). It is not exactly an average but it is an aggregate calculated number. So even when you do 2 second update the change in value is still 118 second previous seconds of data plus the new 2 second data. Therefore any change in the value will have a substantial lag and decay. For this reason it may be a good reason not to do a progressive constant increase ramp but rather stop for at least 2 minutes and add say 15 seconds so each step is 2:15 in length. The reasoning in my thinking is to wash out the data and get data that actually represents the power or heart rate or what ever that is at that stress point. You really don’t see that until 2 minutes after the change. The fact that DFA a1 does make significant changes to changes in stressors such as power baffles me and because I am no math whiz I have no idea why that is and the math behind DFA is way outside my realm. The best analogy i can think of is normalized power. It is a rolling normalization function for a specified window of time and is therefore heavily smoothed data. If you look at NP every 2 seconds the change is never as significant as value of the power change, ie NP 160 watts but you jump and sprint for 10 seconds at say 500 watts you can see that NP does not go to 500 but might rise to 180??? (just a plug number I did not do any math). Any math wizards out there want to comment on this as it relates to DFA a1? and help me understand why DFA a1 would react fast enough to physiological changes to show any thresholds?
that is not exactly my question, also to quote Marco However, as we know mostly from research carried out at rest, HRV does give us insights on autonomic control of the heart. As such, DFA alpha 1 might be a better tool to look into these dynamic changes, as most other HRV features are of little use when heart rate is relatively high (they are highly suppressed and show no meaningful change even across different intensities, unless we do a maximal test).
For example, improved fitness should result in a lower heart rate at a given external load (power or pace). Alpha 1 might also track these changes. On a day to day basis, fatigue is reflected both in exercise heart rate (typically as an acute suppression) and morning HRV (also a suppression). Exercise HRV, using alpha 1, might also capture fatigue. The reason to go through the trouble of using HRV instead of heart rate, typically is due to the higher sensitivity to stress of HRV, and therefore if this was the case also for alpha 1 during exercise, it would be a good reason to try to use it.
But to get interpretable results the method is important. So what I am questioning is how one should aggregate the data that you compare to DFA a1. The more I read the more I think that the comparison data must span the same range as the a1 data is some normalized or averaged data for the same time window.
@steveneal I think this may be something that yur background may help with. These break points for DFA a1 are not arbitrary (or at lest have some basis in math), it is pretty well known that the range 1.25- 0.75 is the normal range for the patterns seen in many biological or fractal system (meaning in the time domain that any segment will have a similarity to any other segment regardless of size) Said probably more precisely and accurately from a paper I read: It is generally admitted that fractal like fluctuations, which are typical of healthy physiological control, occur over the range 0.75<alpha 1<1.25. That around 0.5 the data is technically called anti correlated, but to my lay way of thinking it is just random with no inherent periodic repeating trends ie white noise. So the fact it does relate to some physiological parameter is not all that surprising. It appears that as we stress the cardiac system with exercise we transition through the orderly state of homoestatic control into one that is basically chaotic when we exceed our LT2. From a physiological point of view that may make sense.
I think how this implemented in real time is still to be worked on. In this thread there are a lot of items and questions. One item of importance I brought up earlier is the need for a 2 minute data sequence for optimal DFA a1 calculations. Also heart rate artifacts will disrupt the patterns and cause problems do the limits for artifacts is quite low and artifact identification and removal is import to the method. In Runalyze the data is all binned, meaning the data one sees in the DFA a1 table is for a 2 minute window as is the power an average of the power over that same 2 minutes. This means the data is heavily smoothed. This is why I currently think that one must stabilize your power at least in 2 minute but probably better longer steps to get clean data. Of course one reason that it may not be universal is the issue of how one’s heart reacts to changes in stressors like exercise and if you have arrhythmias etc. I am still trying to understand this topic but the more I read the more it seems that it might have some utility in the right use case. AI Endurance have implemented a readiness to train idea based upon DFA a1. New readiness to train and durability HRV metrics
So things are progressing… this is something I hope will become another tool in the assessment toolbox.
I have had it confirmed by Dr Rogers that they in fact do use average values that are in sync with the same time span as used for the calculated DFA a1 result. In their paper: Rogers B, Giles D, Draper N, Hoos O and Gronwald T (2021) A New Detection Method Defining the Aerobic Threshold for Endurance Exercise and Training Prescription Based on Fractal Correlation Properties of Heart Rate Variability. Front. Physiol. 11:596567. doi: 10.3389/fphys.2020.596567 the explain the protocol as taking a rolling 2 minute DFA a1 with update every 5 seconds. from the paper: " For example, at a time of 10 min into the testing, the DFA a1 is calculated from the 2 min window starting from minute 9 and ending at minute 11 and labeled as the DFA a1 at 10 min. Based on a rolling time recalculation every 5 s, the next data point would occur at 10:05 min (start 9:05 min and end 11:05 min)." Because of this it can not work as described in this cited paper in real time since you can not know this future data. However Dr. Rogers agrees that the data should span the time of the DFA a1 calculation. As I see it that is not how most users are applying the data. For real time it may be that it does not work as well and can only be performed as a post test calculation. I am not certain if any software other than Kubios can do this? So though they care reporting accurate DFA a1 data the ability to find breakpoints seem not to be applied as per this paper or as described by Dr. Rogers.
Just a new thought on this item. I have looked at this and used various apps to see real time DFA a1 and to date I am not a good candidate for this. It appears that no matter what, my DFA values are not in sync with the break points 0.75 and 0.50. I know Marco Altini is not a fan of DFA a1 but why I am not certain. I think it may be that he thinks this may be more individual than is being reported. I am starting to think the Marco is right, this may be something you need to track individually and use as a tracking metric rather than and absolute value. In other words, if you work at a power of say x% of TP and DFA a1 changes with time to be a higher number maybe that change indicates improved fitness, similar to the HR to Power ratio, as fitness improves HR for a set power is lower. Anyhow the DFA a1 breakpoints are useless for me.