Coach Steve Neal's Adaptive Tempo Fatmax Training

Ok this helps.

With the types of events you are doing raising your Tempo ceiling is a must as you won’t really be reacting to others, just trying to do your best and hold a solid pace all day.

Regarding your plan, I would skip the FTP and head straight to the vo2 (but that is just me). I don’t think I would do it for much more than 2-3 weeks before you come back to what has been working for you.

3 Likes

thanks Steve - will take your advice

2 Likes

Steve - at the risk of over staying my welcome, I’d really like to find out more about the MAP intervals you’ve mentioned in a few places. I’ve read lots about Thibault’s model and saw your recommendations, but would like to try and understand more about how these HIIT options might be used - I’ve seen you say you like the 85% MAP sessions for endurance but I’m wondering how this level of intensity plays a role here vs 90 or 95%? I haven’t done the ramp test yet but a guessing 85% of MAP is >FTP?

Hello everyone interested in this.

I know I always use a percentage of maze heart rate because that is the vast majority for people I have tested.

I will out together a video of how my information came about and exactly what I am looking at when I can measure it.

It will take me a few days but I hope you find it interesting.

Basically I wil show you the test is do … using a metabolic cart and how that information is tied to lactate and then eventually moxy.

Thanks for the interest in the threads.

For people that know me if we all agree we train 80-90% of the time in tempo and below then I feel that should be measured accurately and I feel I have a pretty solid way to do so.

Stay tuned.

10 Likes

Oh dear…yes 2x30 or 3x20

Either will be fine if you are doing at the right level.

Steve

1 Like

I had a go at the Ultimate today to see what it was like… Thought it was going to destroy me but I was quite surprised how I got through it and it left me wondering if I did it hard enough or was not really understanding what to expect.

After the first 3x(40/20) my RPE and HR was just not very high and nowhere near a vo2 workout. For the rest I just went as (sustainably) hard as I could for the duration of the intervals. It just seemed that these short duration intervals weren’t really long enough to get me to a state that felt close to vo2 max before the 3 reps were done and we had 2m more rest, and I could recover. I was really smashing the 30/30s and 20/40s as hard as I could and at 110-115rpm and while I havent done a 3m ramp test, I was well above my 5m power from my test at the start of this week. I understand from reading articles by Thibault that 5 or 6 min power is a reasonable proxy for MAP from his ramp, yet I was well over that for most of the intervals. WKO gave me a paltry 2’30" over 90% vo2 for the entire session and only on the last 2 reps did my HR get above LTHR. It felt like a HARD session but just not one that felt like a good vo2 workout.

I think I may try some longer intervals from his chart to see if that is more effective at getting me to the ‘fish out of water’ breathing people associate with vo2.

1 Like

Hi,

Before you dive into the longer intervals can you send me a screenshot of your session from wko5.

Also, it usually takes people a few sessions to dial this in.

done - hopefully this is the ride shot but can send a fit file if thats better?

Just listened to the podcast, really interesting, and bit on protein at the end and the palm method was an easy way to understand it. Anyway, since it’s mild enough to ride outdoors in England, today I tried a bit of this outdoors.

On one of my regular loops I used the first 20 mins as my usual getting up to operating temperature mode. Then I hit the first hill and rather than HR cap at LT1 HR, I moved the cap up to the 82%. Then at the top I allowed HR to drop a bit and hold it around 78-80%

My 75 min ride came out with 45 mins below LT1 and 30 mins between LT1 HR and 82% max HR. Not quite 3 x 20 min but an interesting introduction. It was also interesting getting a feel for RPE when I hold it in that range, it felt comfortable for the time I did it.

I think this would be an interesting and productive way to progress my aerobic base when I’ve maxed my hours or I can’t do as many hours in a week as I’ve got used to.

Tomorrow I’m off on an approx 4-4.5 hour ride below LT1 but I might add some low tempo efforts once on traffic free sections where I think a solid 20 mins can be held without interruption.

2 Likes

Yesterday’s ride was 4 hours 11 mins. 3 hours 12 mins of the ride was below LT1 and 59 mins in the low tempo with cap of 82% used here. Enjoyed that.

1 Like

How can we gauge if our fatmax zone is actually improving with this style of training? It was my understanding that an individuals fatmax doesn’t necessarily move in line with the lactate thresholds so if you see improvements in your LT1 with this tempo training is it possible that your fatmax has not changed? Especially if it’s recruiting predominantly carbohydrates. Unfortunately I am already utilising 50% carbs even in zone 2.
Are there physiological markers for the fatmax zone?

1 Like

@Hank_Reckless How did you conclude your are using 50% carbs in zone 2?

Your progress will show from the power output in the same heart rate zone. The heart rate zone should be representative for predominantly fat utilisation / oxidative fibers.

1 Like

Fat Max will always be tied very closely to LT1, but may not improve in everyone.

First this is how I define these metrics myself.

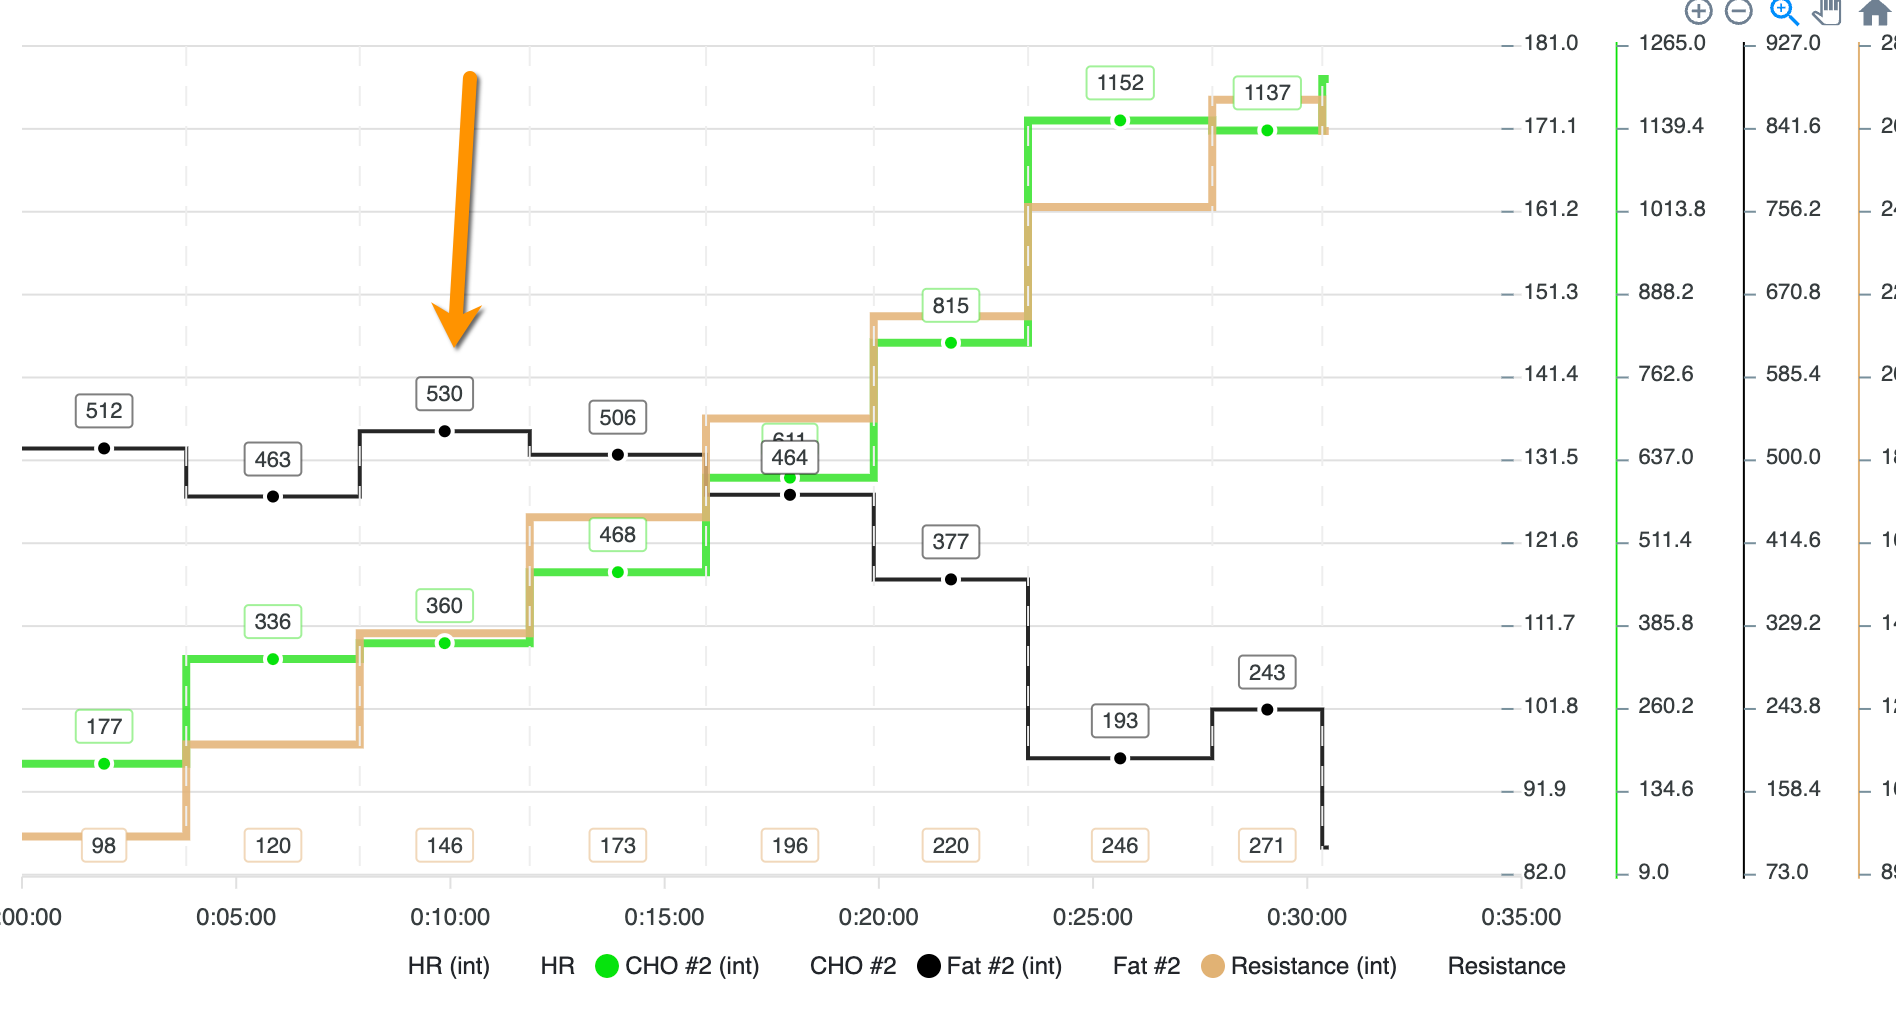
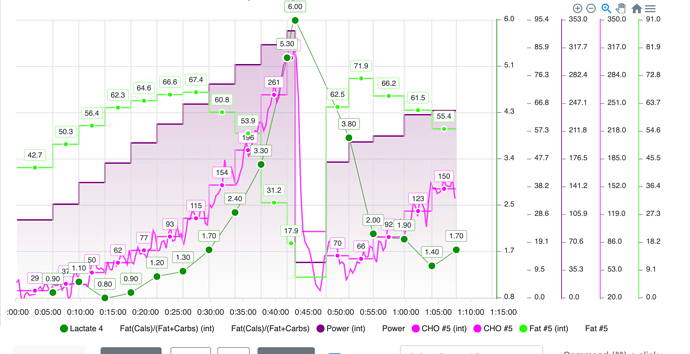
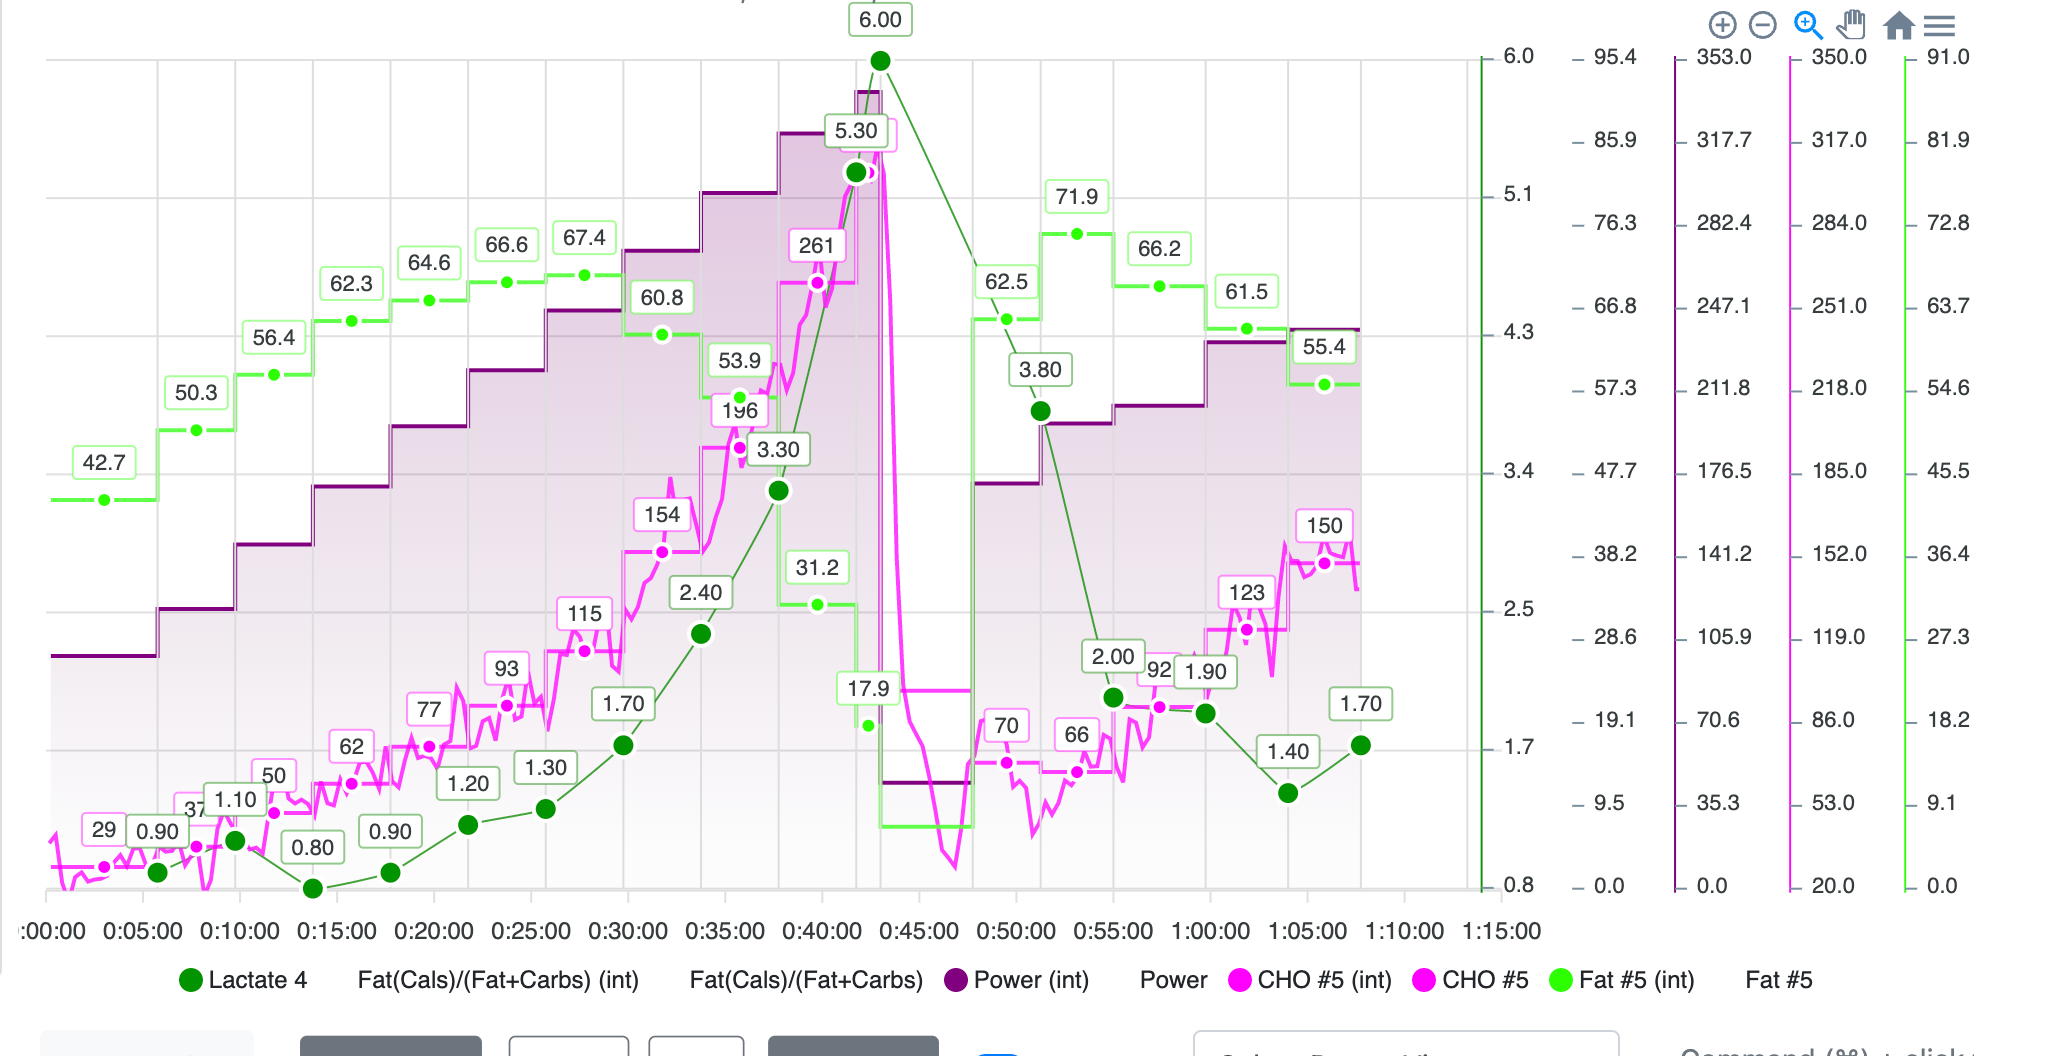
In the picture below, you will see ACTUAL fatmax is just after LT1.

I like to score fatmax as the highest amount of fat with the least amount of carbs, this spot is much easier to find in a test. You can not this by the sudden increase in carbs at fat max (keep in mind this is only during 4m of a step test, so in longer sessions, this is another reason I use the number I do).

You can also see that the lactate curve near LT1 and the Carb curve have an identical reaction.

So for me, fatmax tied by the pretty closely to LT1.
fat carbs lactate

Below same pic with arrow at fatmax ceiling.
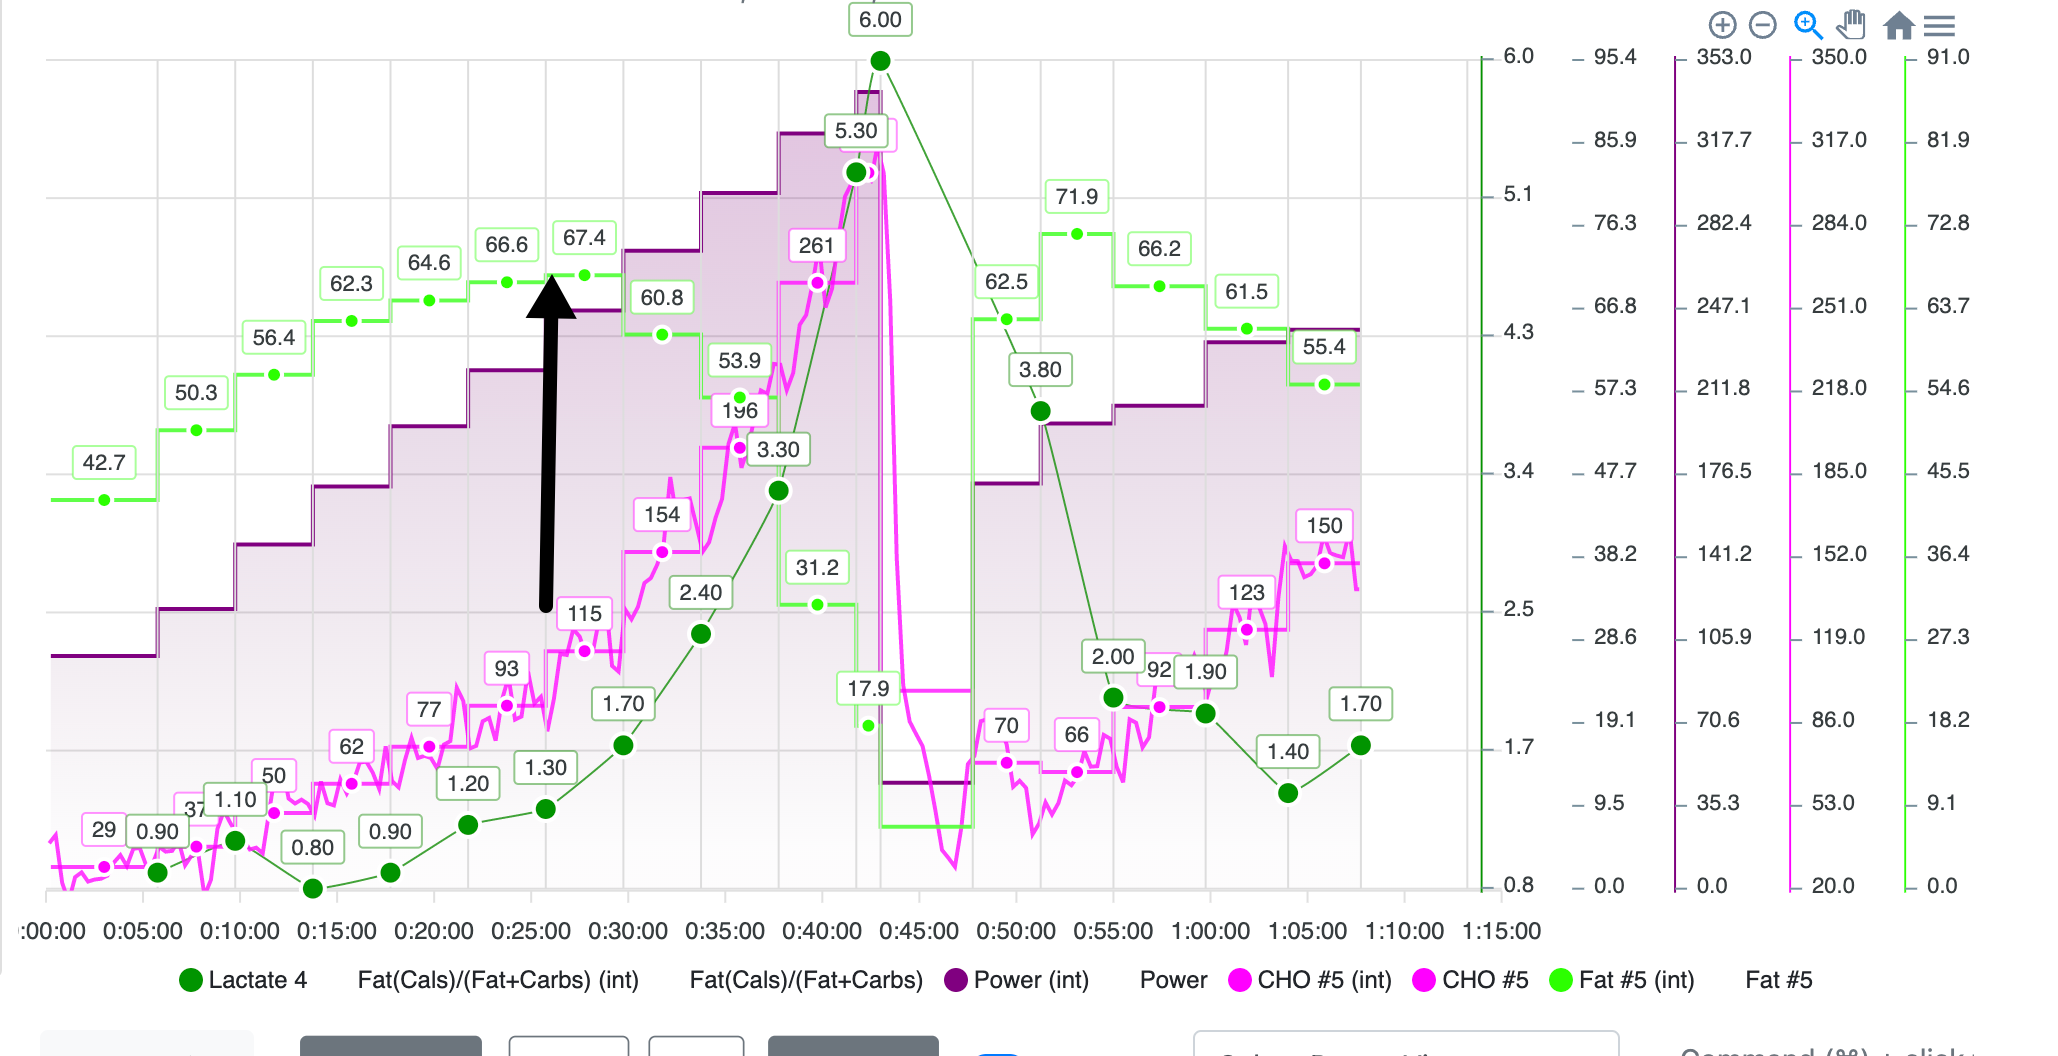
fat carbs lactate with fatmax

So what change is the % ratio of CHO and FAT, and as you utilize fat longer, this would be the flattening of the lactate curve after LT1 (less carb contribution after LT1 would be mean lower lactate measurements)

So below is the same athlete looking at FAT and CHO ratio out of 100%.
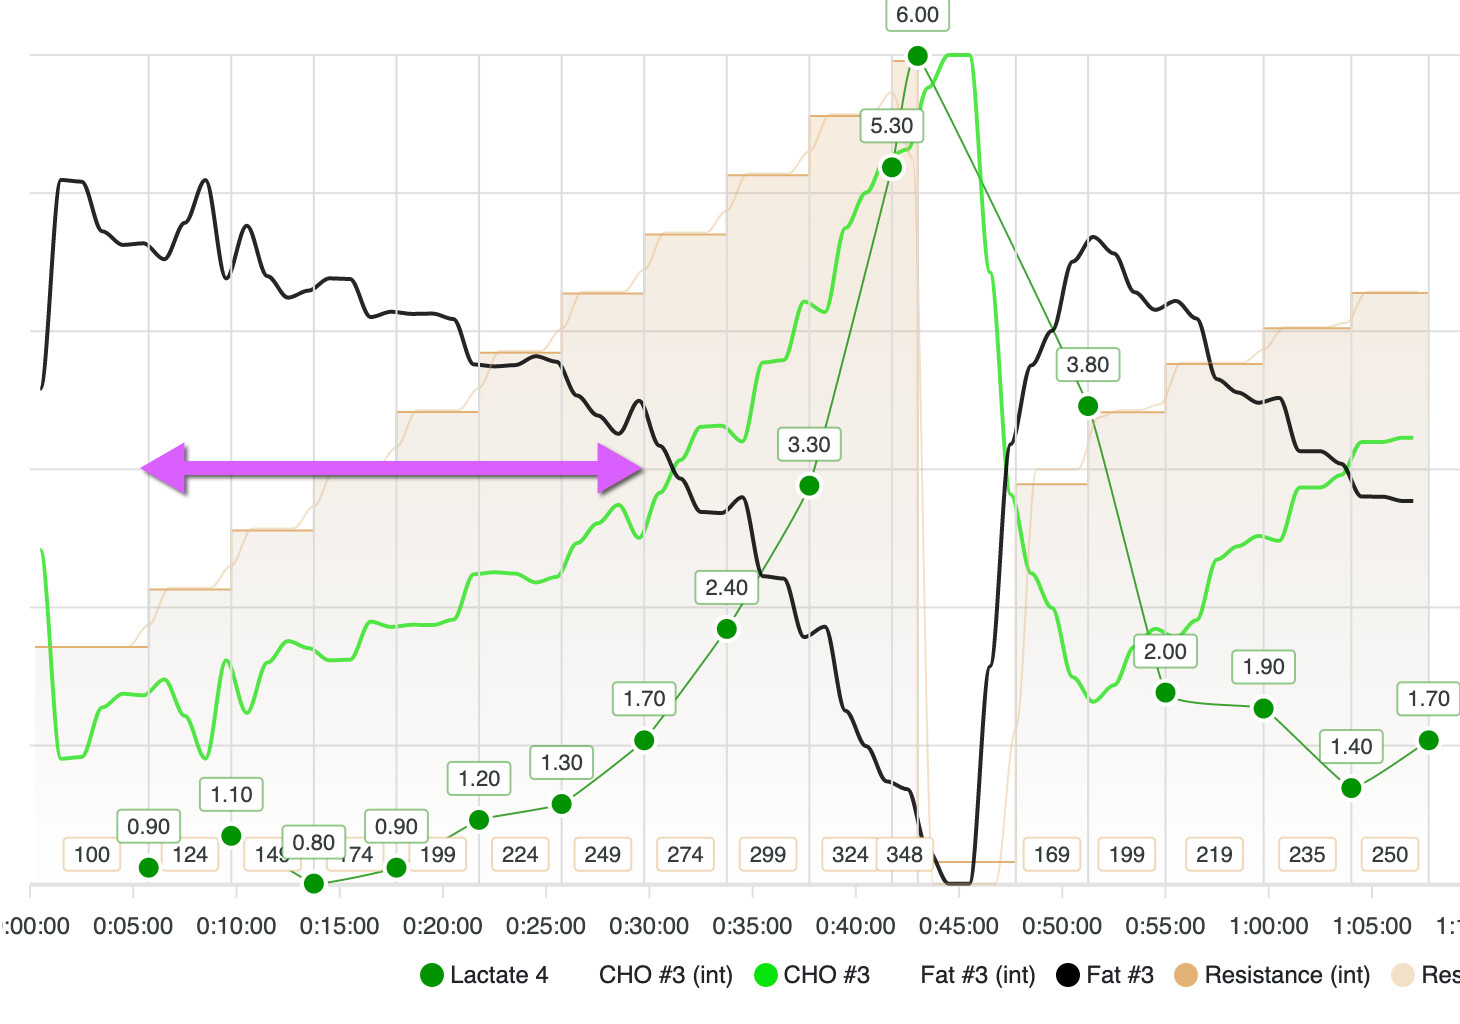
fat cho cross

In an athlete with fat cho crossover to to the left, the lactates would be higher do to sooner fat cho crossover.

Below is an example of fat cho / near fat cho crossover, lower levels.
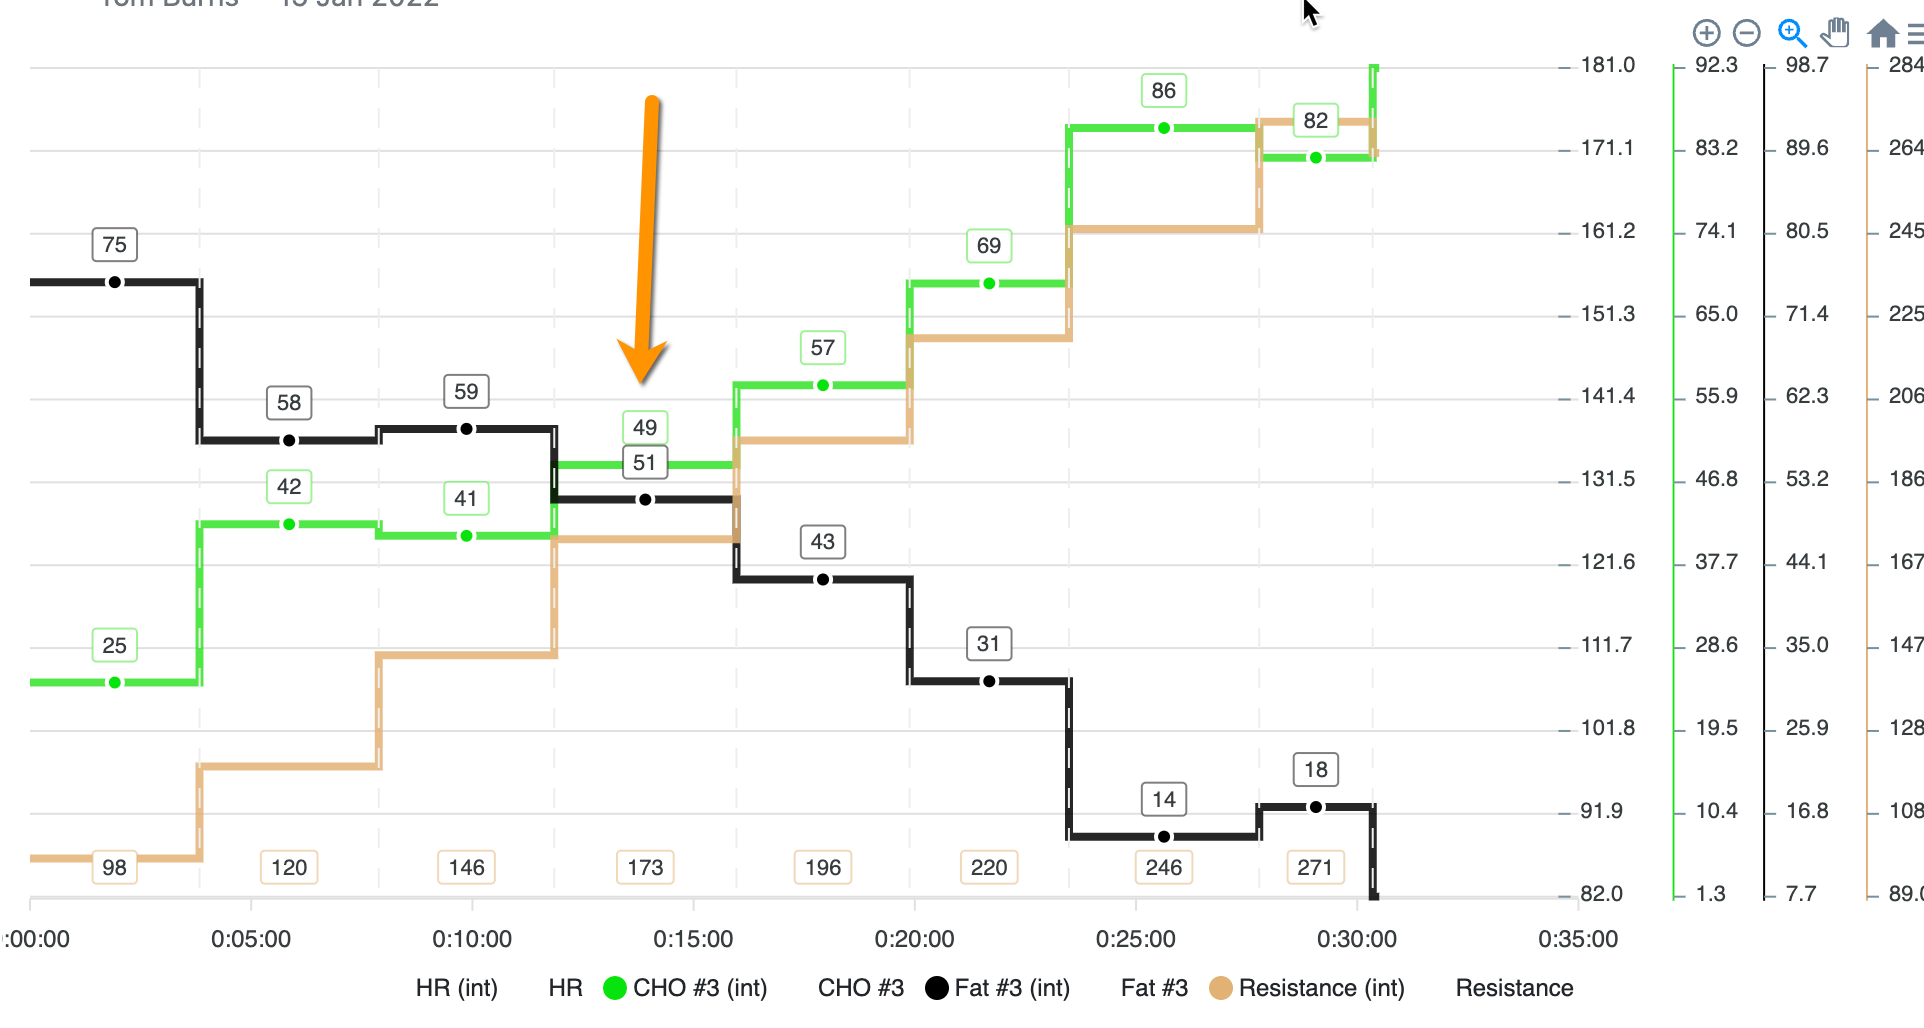
T crossover

Fat Max same athlete

t fat max

Comparing the two below.

fat crossover compare

Same protocol for both athletes.

If we look at the fatmax and crossover relative to map this is where the difference lies.

They would have different nutritional strategies (athlete one having a hard time fuelling long rides at endurance/tempo pace for sure, the other very different nutrition needs and much higher performance.

So to know fatmax improving, LT1 would move to the right.

So your fatmax could stay at 200w, but move crossover to the right, keeping map the same and you would likely be faster and improve in longer events.

Sorry for long answer hope I finally got to some points that make sense.

4 Likes

@kjeldbontenbal From my INSCYD report

@steveneal Wow Steve, appreciate the comprehensive answer. Read it a couple times to digest it all!
Just to put it in simple man’s terms for myself - Fatmax may not change at all but what can change is the crossover point of fat:carb, and this will likely extend with improvements to LT1.

1 Like

Sort of, I am not the best at explaining in writing will try a different way.

Lt 1 may stay the same but improvements can still come from the flattening of the curve after LT1.

1 Like

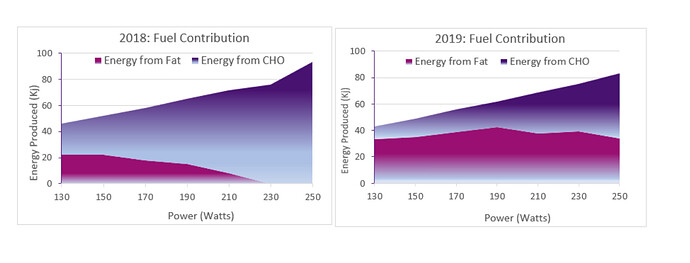
Here is a graph of Fatox vs. CHO for an Ironman athlete from University of Loughborough, England. As you can see, you can make substantial changes to fat contribution to energy demand.

1 Like

Ahh I see, you did say that in your previous post I just confused lower lactate measurements with meaning a shifting LT1 where it’s simply just a flattening of the curve.

Thanks @Phil it’s nice to know there’s still hope for me!

Fat Max will always be tied very closely to LT1, but may not improve in everyone.

First this is how I define these metrics myself.

In the picture below, you will see ACTUAL fatmax is just after LT1.

I like to score fatmax as the highest amount of fat with the least amount of carbs, this spot is much easier to find in a test. You can not this by the sudden increase in carbs at fat max (keep in mind this is only during 4m of a step test, so in longer sessions, this is another reason I use the number I do).

You can also see that the lactate curve near LT1 and the Carb curve have an identical reaction.

So for me, fatmax is tied pretty closely to LT1.

1 Like